Fig. 1.
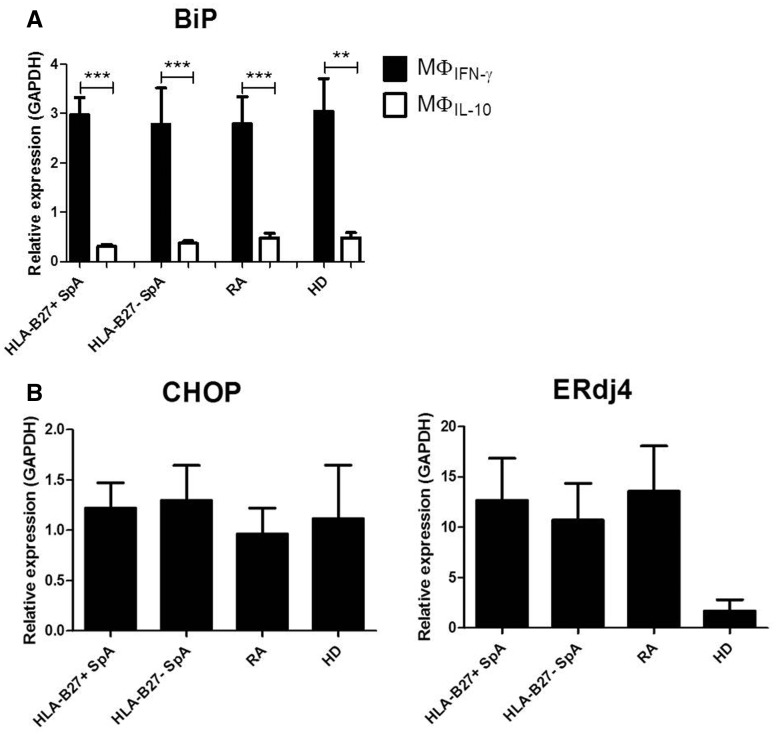
Endoplasmic reticulum stress marker expression by macrophages from HLA-B27+ SpA compared with HLA-B27− SpA, RA and healthy donors
Graphs represent mRNA expression of BiP by MΦIFN-γ and MΦIL-10 (A), and respectively mRNA expression of CHOP and ERdj4 by MΦIFN-γ (B), after lipopolysaccharide stimulation. The mRNA levels were measured by qRT-PCR, normalized to the expression of GAPDH. Bars represent the mean (s.e.m.). **P < 0.01, ***P < 0.001.

