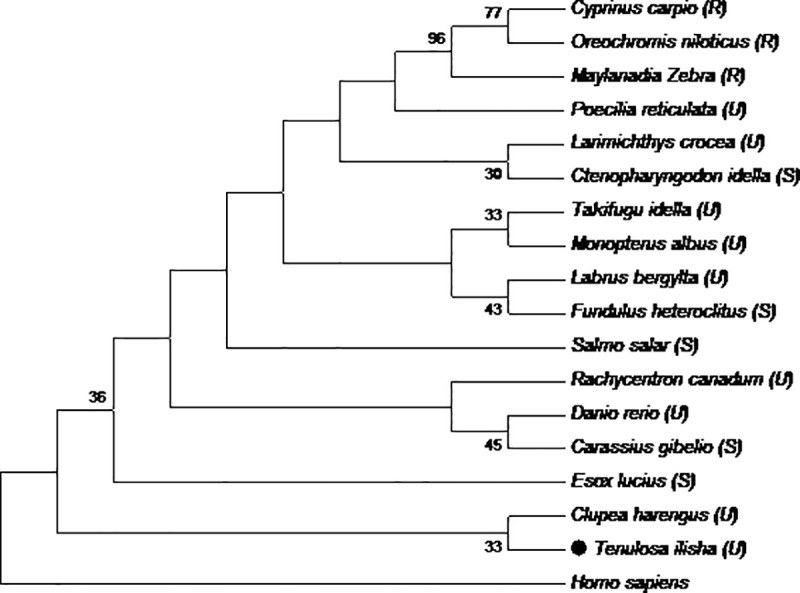
Fig 4. Phylogenetic analysis based on EUS markers in A2ML transcript from disease resistant (R), susceptible (S) and unknown (U) fish species including study species T. ilisha (shown in black circle).

Homo sapiens is taken as the outgroup and node support is indicated by bootstrap values. The scale bar represents 0.05 substitutions per site.
