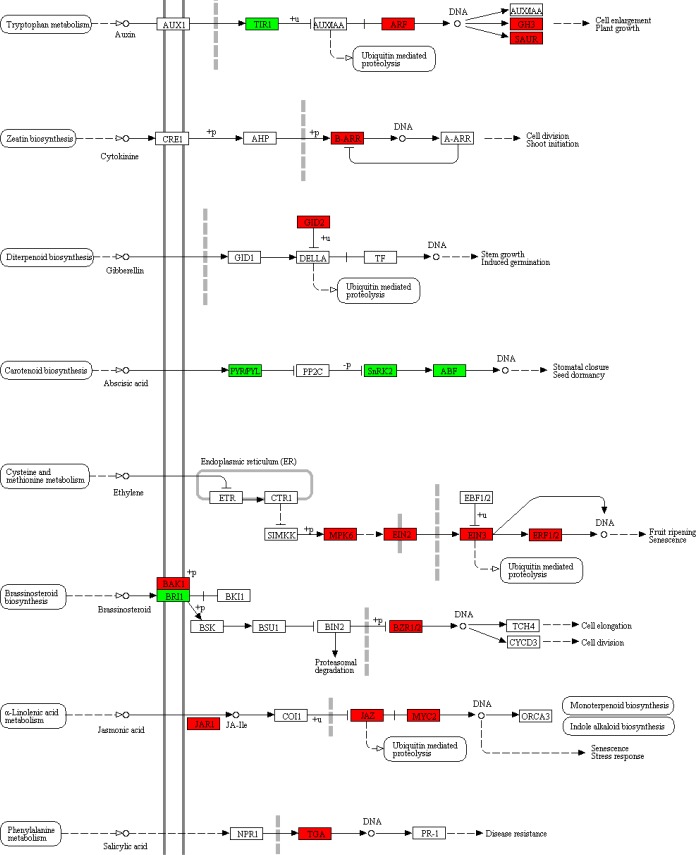
Fig 7. Changes of key genes in KEGG pathway of plant hormone signal transduction.
The basic flow chart was obtained from the website (https://www.kegg.jp/dbget-bin/www_bget?map04075). Red box: significantly upregulated in treatment with 30‰ compared with the control. Green box: significantly downregulated in treatment with 30‰compared with the control.

