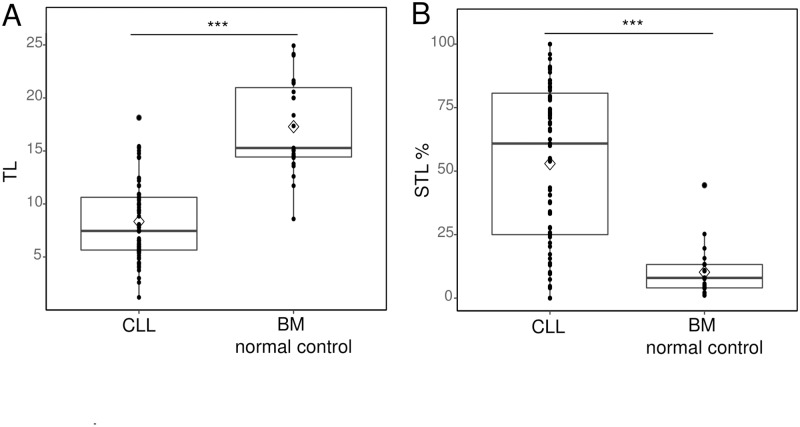
Fig 1. The TL and STL% of CLL patients.
(A) The mean telomere lengths (TLs) were compared between CLL patients and bone marrow (BM) from normal controls. The CLL patients’ TLs were shorter than those in the normal BM samples with age adjustment (7.46 (range 1.19–18.14) in CLL patients; 15.28 (range 8.59–24.93) in normal BM control samples, median value). (B) The STL% was compared between the CLL patient group and normal BM control group. CLL patients had a higher STL% than the control group (52.95 (± 31.33) in the CLL group and 10.20 (± 9.65) in the normal control group). *** indicates p < 0.001 for comparison.

