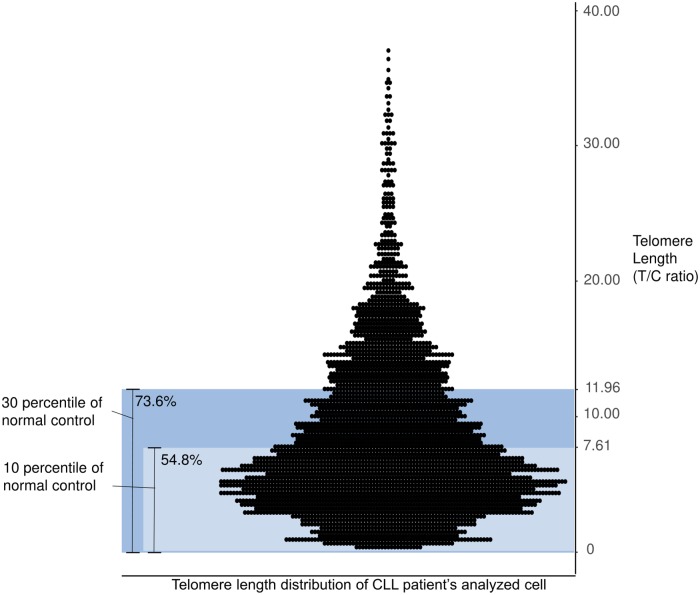
Fig 2. The TL distribution of CLL patients’ analyzed cells.
The TLs of analyzed cells from CLL patients (n = 71) and the normal control percentiles are presented in the dot plot and bar. The TLs of CLL cells were generally biased to the lower percentile of the normal control group. Cells with TLs shorter than 7.61, the length of the 10th percentile of a normal TL, accounted for 54.8% of CLL cells, and cells with a TL shorter than 11.96, the length of the 30th percentile of a normal TL, accounted for 73.6% of CLL cells. CLL patients’ cells with a TL longer than 40.00 (T/C ratio) are not shown in this graph (n = 4, range 44.59–56.70).

