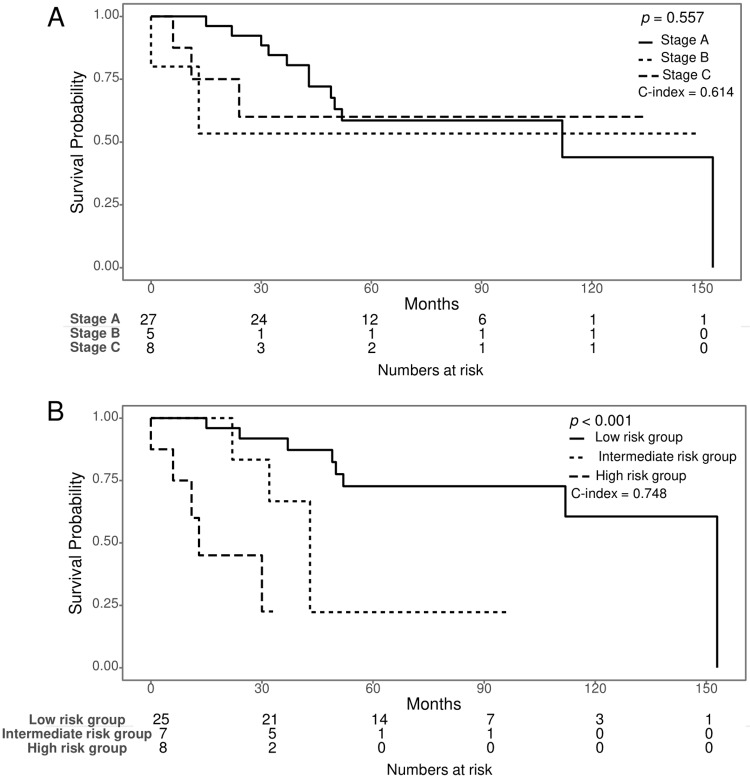
Fig 6. Survival Analysis of the risk equation model compared to Binet stage.
(A) In the Kaplan-Meier (K-M) curve, the Binet stage did not show survival differences, and the survival graphs overlapped each other. (B) The risk groups stratified by the risk factor equation of Korean CLL patients showed better K-M survival curves than those stratified by the Binet stage. The risk equation model was complex karyotype × 2.46 + TP53 mutation × 1.49 + total mutated gene number × 0.61. The low-, intermediate-, and high-risk groups were divided by a risk equation score of 1.83 or less, 1.83 to 3.08, and greater than 3.08, respectively. Harrell’s C-index of risk groups assessed by the risk equation (0.748) was also higher than that of groups stratified by Binet stage (0.624).

