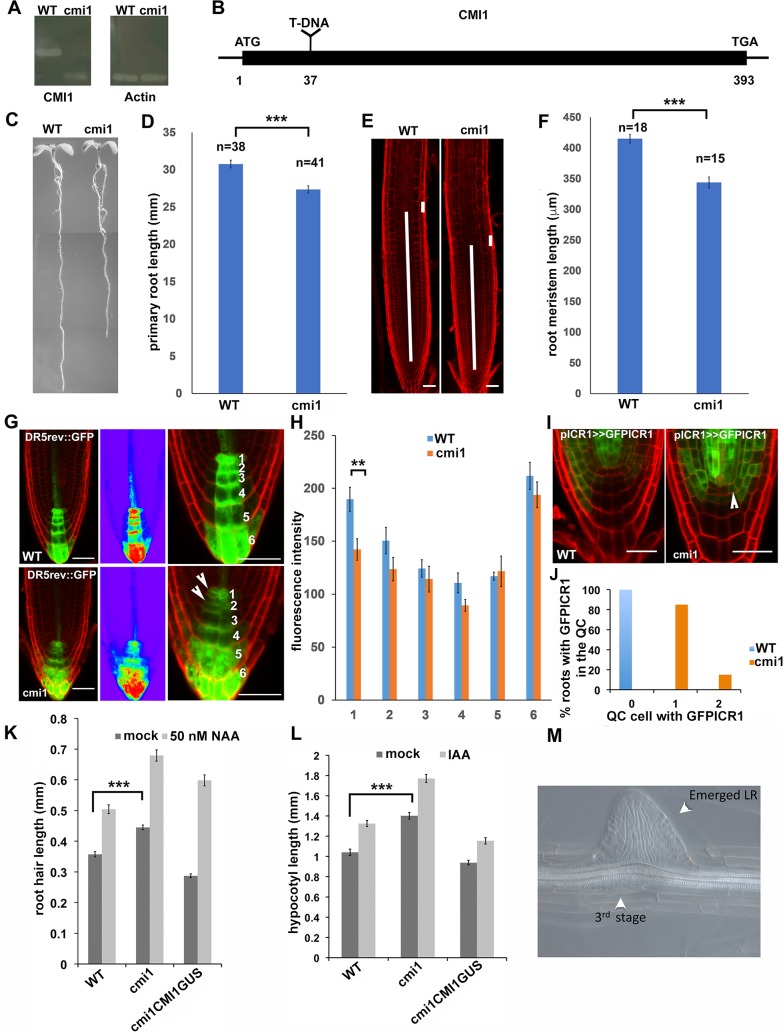
Fig 2. cmi1 mutant plants have higher ICR1 levels in the QC, shorter primary root, and longer root hairs.
(A) The CMI1 RNA cannot be amplified in cmi1, indicating that the mutant is a null. (B) A diagram of the CMI1 gene highlighting the T-DNA insertion at position 37. (C) cmi1 seedlings (7 days old) have shorter primary roots. (D) Quantification of the root length in WT (Ler) and cmi1 plants. Error bars are SE, p ≤ 0.001 (t test). (E) Root cell division zones of WT (Ler) and cmi1 7-day-old seedlings. The long bars highlight the measured root zone length. The short bars show the cell length used to determine the end of the cell division zone. (F) Quantification of the root cell division zone length calculated with root samples as shown in (E). Error bars are SE, p ≤ 0.001 (t test). (G and H) DR5rev::GFP auxin response maximum is reduced in cmi1 QC. (G) Cell walls were stained with PI. The middle panels show heat diagram of the roots shown in the left panels. Right panels show higher magnifications used for quantifications. The numbers correspond to cell layers. Arrowheads highlight the signal reduction in cmi1 compared to WT. (H) Quantification of DR5rev::GFP fluorescence intensity in cell layers 1–6 as defined in panel G. Layer 1 is the QC. Error bars are SE, p ≤ 0.01 (t test). (I) GFP-ICR1 expression is up-regulated in the QC (arrowhead) in cmi1 roots. (J) Percentage of WT and cmi1 roots with GFP-ICR1 expression in 1 or 2 QC cells. (K) Root hair length in Ler (WT), cmi1, and cmi1 complemented with CMI1-GUS (cmi1CMI1GUS) in control (mock) or following treatments with 50 nM NAA. The root hairs in cmi1 mutants are significantly longer than in the WT and roots complemented with CMI1-GUS. Bars are SE, p ≤ 0.001 (t test). (L) Hypocotyl length is increased in cmi1 mutants and in response to 5 μM IAA treatments. Hypocotyls of cmi1 mutants are significantly longer than those of the WT and seedlings complemented with CMI1-GUS. Bars are SE, p ≤ 0.001 (t test). (M) A stage 3 LRI developing opposite to an emerging LRI in a cmi1 root. Scale bars, (E) 50 μm and (G and I) 20 μm. Underlying data for this figure can be found in S1 Data. CMI1, Ca2+-dependent modulator of ICR1; GFP, green fluorescent protein; GUS, GUS, β-glucuronidase; ICR1, interactor of constitutively active ROP; Ler, Landsburg erecta; LR, lateral root; LRI, LR initial; PI, propidium iodide; QC, quiescent center; WT, wild type.

