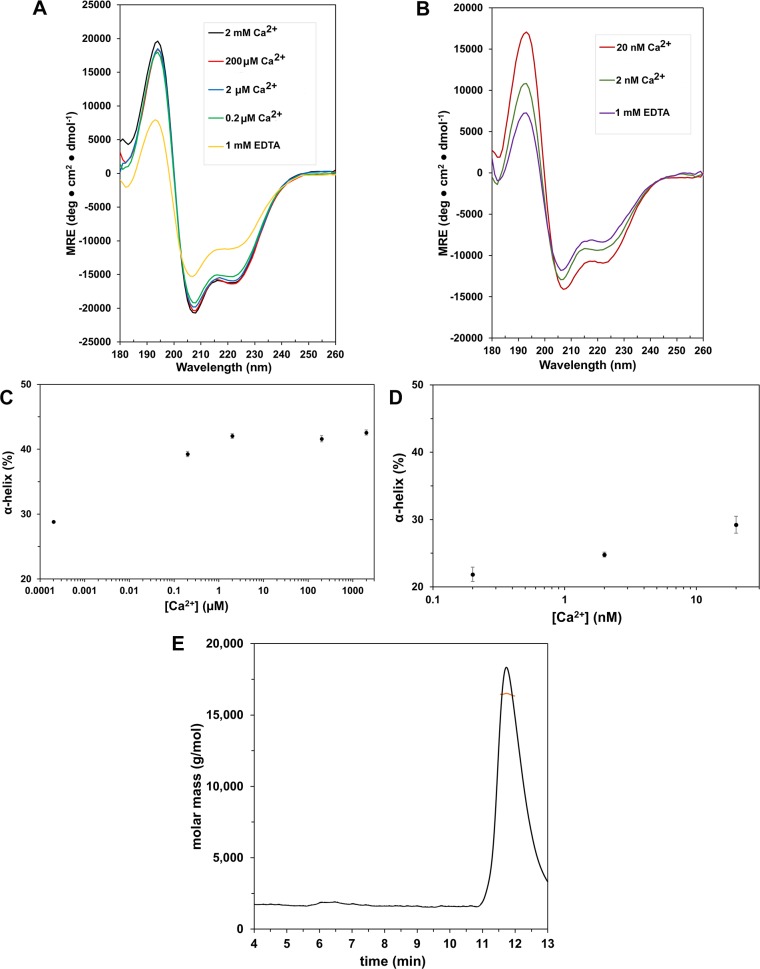
Fig 7. CMI1 changes secondary structure in free Ca2+ concentration ranging between 10−9 and 10−8 M and is a monomer in solution.
(A and B) CD spectra of 60 μM CMI1 at indicated free Ca2+ concentrations. Each curve is labeled as per legends. Measurements presented in (A and B) were carried out on different days. (C and D) Percentage of α-helix of CMI1 at different free Ca2+ concentrations calculated from the CD spectra in (A and B), respectively. (E) An SEC-MALS elution profile of 4 μg CMI1 in 2 mM Ca2+ solution. CMI1 eluted as a single peak with a molecular mass (red line) corresponding to a monomeric form. Underlying data for this figure can be found in S1 Data. CD, circular dichroism; CMI1, Ca2+-dependent modulator of ICR1; ICR, interactor of constitutively active ROP; M, million; MRE, mean residue ellipticity; SEC-MALS, size-exclusion chromatography multiangle light scattering.

