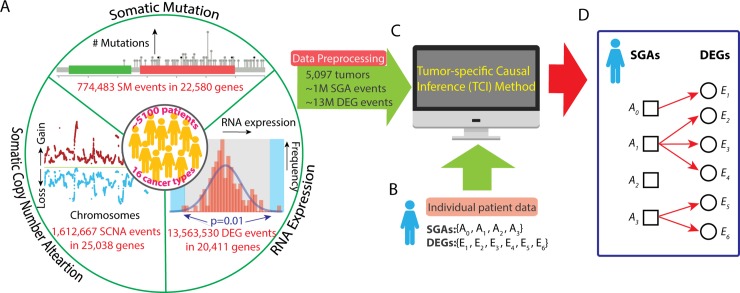
Fig 1. Workflow of TCI analysis.
A. A compendium of cancer omics data is used as the training dataset. Three types of data from the 5,097 pan-cancer tumors were used in this study, including SM data (774,483 mutation events in 22,580 genes), SCNA data (1,612,667 copy number alteration events in 25,038 genes), and gene expression data (13,563,530 DEG events in 20,411 genes). SM and SCNA data were integrated as SGA data. Expression of each gene in each tumor was compared to a distribution of the same gene in the “normal control” samples, and, if a gene’s expression value was outside the significance boundary, it was designated as a DEG in the tumor. The final dataset included 5,097 tumors with 1,364,207 SGA events and 13,549,660 DEG events. B. A set of SGAs and a set of DEGs from an individual tumor as input for TCI modeling. C. The TCI algorithm infers the causal relationships between SGAs and DEGs for a given tumor t and output a tumor-specific causal model. D. A hypothetic model illustrates the results of TCI analysis. In this tumor, SGA_SETt has three SGAs plus the non-specific factor A0, and DEG_SETt has six DEG variables. Each Ei must have exactly one arc into it, which represents having one cause among the variables in SGA_SETt. In this model, E1 is caused by A0; E2, E3, E4 are caused by A1; E5, E6 are caused by A3; A2 does not have any regulatory impact.

