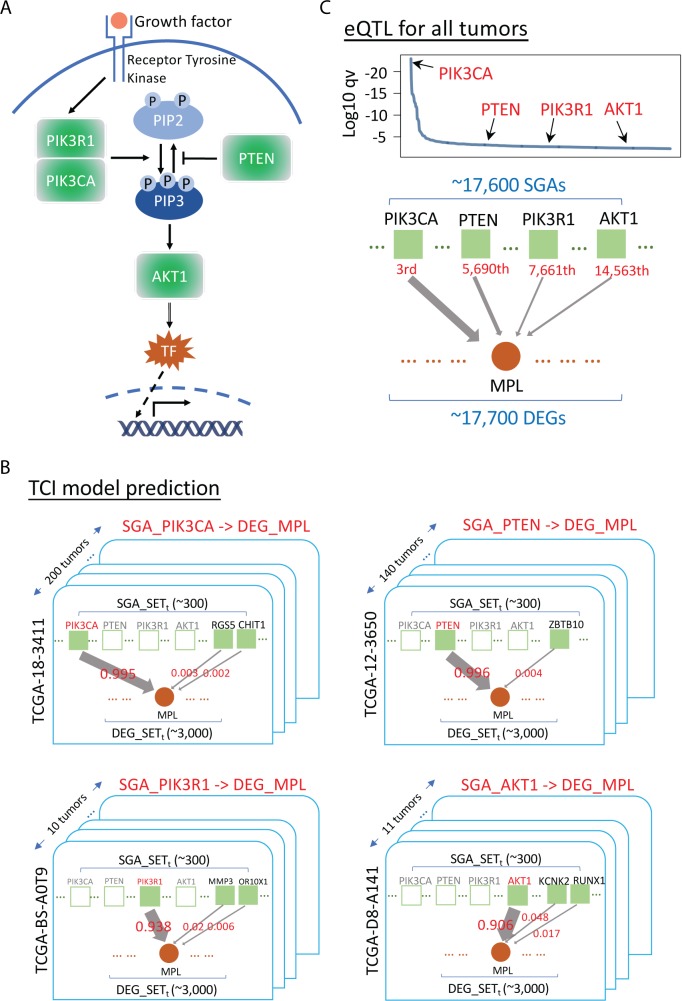
Fig 2. Estimation of the most probable causative SGAs for MPL by TCI and eQTL.
A. A diagram of PI3K/AKT pathway, with PIK3CA, PTEN, PIK3R1 and AKT1 as key signaling proteins in the pathway. B. Results of TCI analysis of the most probable causes of the DEG MPL. There are ~300 SGAs and ~3,000 DEGs in each tumor on average, which are organized as a bipartite graph respectively. Solid green squares represent SGAs present in the current tumor; empty green square represent SGAs not present in the current tumor. For a DEG observed in a tumor, e.g., MPL, TCI aims to search for the most probable cause among SGAs observed in the tumor. An arrow represents a causal link between an SGA and a DEG, while the weight of an arrow represents the posterior probability that the SGA causes the DEG in the current tumor. PIK3CA is predicted to be the most probable cause for DEG MPL in 200 tumors; thus, we rank PIK3CA as 1st. PTEN is the most probable cause for DEG MPL in 140 tumors, ranking it as the 2nd most probable cause of DEG MPL. AKT1 is the most probable cause for DEG MPL in 11 tumors, and PIK3R1 is the most probable cause for DEG MPL in 10 tumors. C. eQTL analysis of the possible causes of DEG MPL. eQTL considers all SGAs (i.e., ~17,600 SGAs) as possible causes for DEG MPL. The p values of PIK3CA, PTEN, PIK3R1 and AKT1 were ranked as having the 3rd, 5,690th, 7,661th and 14,563th strongest association with DEG MPL, respectively.

