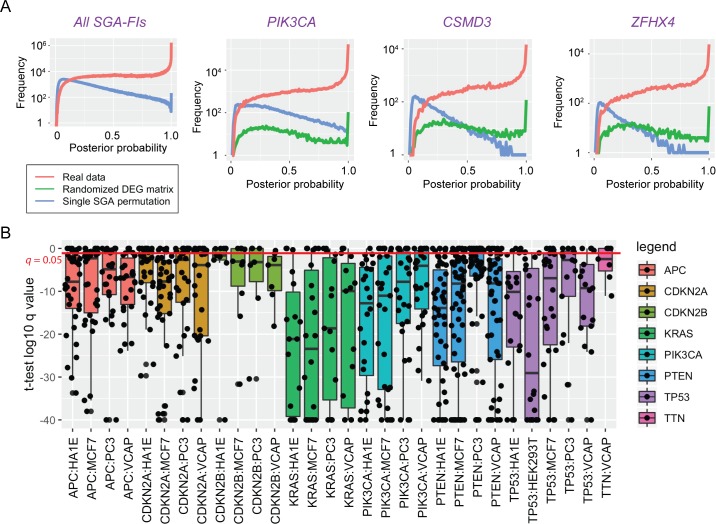
Fig 5. Statistical and experimental evaluation of TCI predictions.
A. The causal relationship inferred by TCI is statistically sound. Plots in this panel show the probability density distribution of the highest posterior probabilities assigned to each DEG in TCGA dataset, when the TCI algorithms was applied to real data (red) and two random datasets, in which DEGs permutated across all tumors (blue) and the corresponding SGA permutated across all tumors (green). The panel on the left shows the results for the posterior probabilities for all most probable candidate edges in whole dataset; rest of the plots show the distributions of posterior probaiblities of most probable edges pointing from 3 specific SGAs to predicted target DEGs. B. Boxplots of q-values of t-test associated with predicted target DEGs for 8 SGA-FIs in different LINCS cell lines that were experimentally perturbed. Each box represent one SGA perturbed in one cell line. For example, APC-HA1E denotes that APC perturbed in HA1E cell line. Each black dot represents a q-value associated with a target DEG of an SGA-FI, when the expression value was assessed with a t-test of the before and after genetic manipulation of a given SGA-FI gene.

