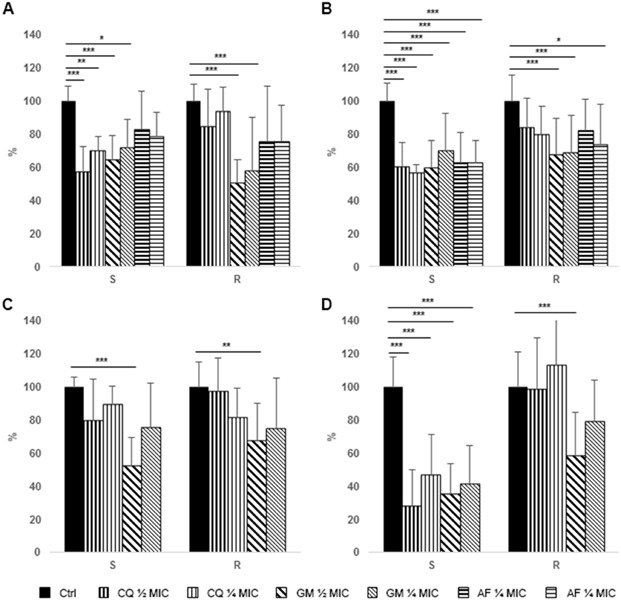
Figure 1.

Effect of antimicrobial treatment on S. aureus and P. aeruginosa biofilm analyzed by means of crystal violet assay. Data are expressed as percentage reduction with respect to control. (A) Prevention of S. aureus biofilm formation. (B) Treatment of S. aureus pre-formed biofilm. (C) Prevention of P. aeruginosa biofilm formation. (D) Treatment of P. aeruginosa pre-formed biofilm. S = MSSA or P. aeruginosa susceptible to carbapenems, R = MRSA or P. aeruginosa resistant to carbapenems. Ctrl, control (black bars), CQ, chlorquinaldol (½ MIC, bars with thicker vertical lines, ¼ MIC, bars with thinner vertical lines), GEN, gentamicin (½ MIC, bars with thicker oblique lines, ¼ MIC, bars with thinner oblique lines), FA, fusidic acid (½ MIC, bars with thicker horizontal lines, ¼ MIC, bars with thinner horizontal lines). *p<0.01, **p<0.005, ***p<0.001.
