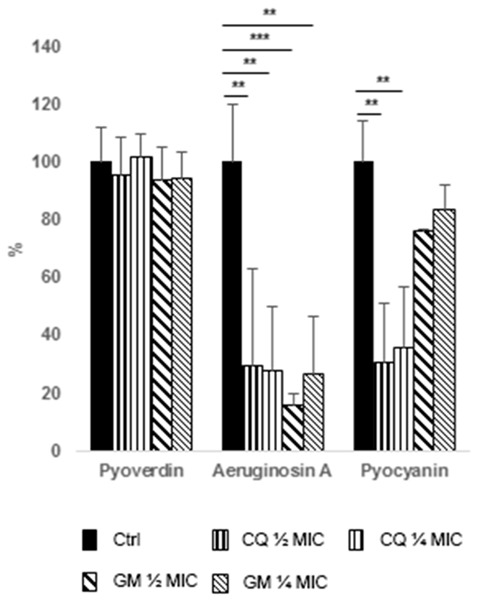
Figure 3.

Effect of antimicrobial treatment on pigment production by P. aeruginosa. Data are expressed as percentage reduction with respect to control. Ctrl, control (black bars), CQ, chlorquinaldol (½ MIC, bars with thicker vertical lines, ¼ MIC, bars with thinner vertical lines), GEN, gentamicin (½ MIC, bars with thicker oblique lines, ¼ MIC, bars with thinner oblique lines). *p<0.01, **p<0.005, ***p<.001.
