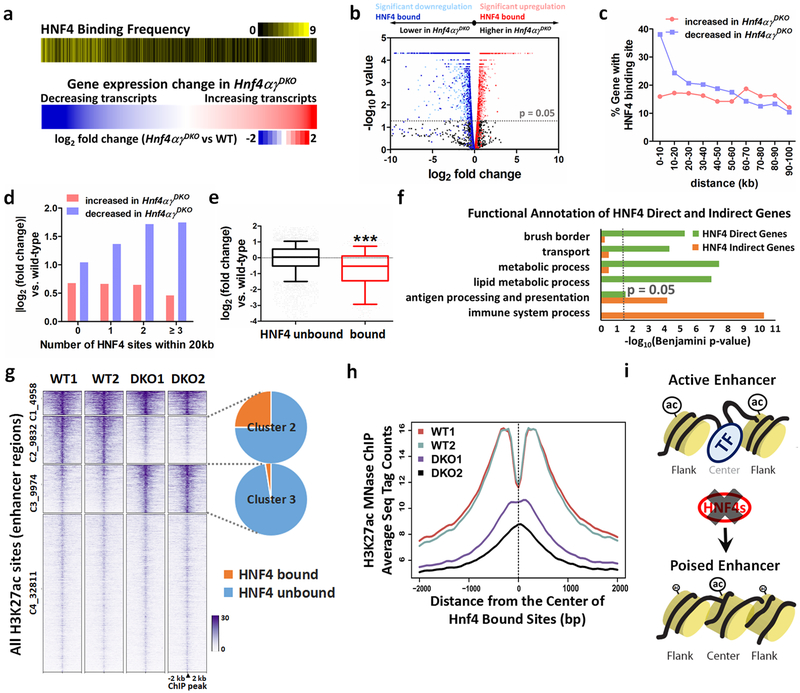
Figure 2. HNF4 binding is required to activate enhancer chromatin and stimulate genes required for intestinal differentiation.
HNF4 factors function primarily to activate rather than repress transcription, as evidenced by (a) heatmaps (Kolmogorov-Smirnov test, one-sided for positive and negative enrichment scores, P < 0.001). The lower heatmap displays a log2 fold-change in gene expression (n = 3 biologically independent mice). The upper heatmap shows the corresponding frequency (yellow shading) of HNF4 binding sites located within 20 kb of the TSSs of the corresponding genes in 10-gene binned groups displayed in the expression heatmap. b, Volcano plot of gene expression changes (n = 3 biologically independent mice). Significant genes were called via Cuffdiff. c, Distribution of TSS distances in 10-kb windows from the nearest HNF4 binding sites. Genes with an FDR < 0.05 are determined as either decreased or increased in the Hnf4αγDKO duodenum compared to the controls (n = 3 biologically independent mice). Downregulated genes are more likely to have nearby HNF4 binding sites than upregulated genes. d, Genes that decrease in HNF4-deficient epithelium are more likely to harbor multiple HNF4 binding events than genes that show increased expression (n = 3 biologically independent mice). e, HNF4 bound genes are significantly downregulated in Hnf4αγDKO compared to unbound genes. The middle line represents the median; whiskers represent the 10th and 90th percentile (Mann-Whitney test, two-sided at P < 0.001 ***; n = 3 biologically independent mice). f, Functional annotation of HNF4 direct and indirect genes (log2 fold-change < −1, FDR < 0.05) by DAVID. Direct genes: HNF4 bound genes (genes within 30 kb of annotated TSSs nearby HNF4 binding sites). Indirect genes: HNF4 unbound genes. Benjamini P values were calculated using DAVID. g, MNase-ChIP-seq profiles (k-means = 4, MACS P ≤ 10−5) of H3K27ac. Statistical tests were embedded in the MACS package. h, Aggregate plots of H3K27ac ChIP-Seq signal are centered on the 5,952 enhancer sites that are bound by HNF4, and loss of HNF4 paralogs prominently reduces H3K27ac signal. i, Model of HNF4-control of active chromatin structures in the intestine.

