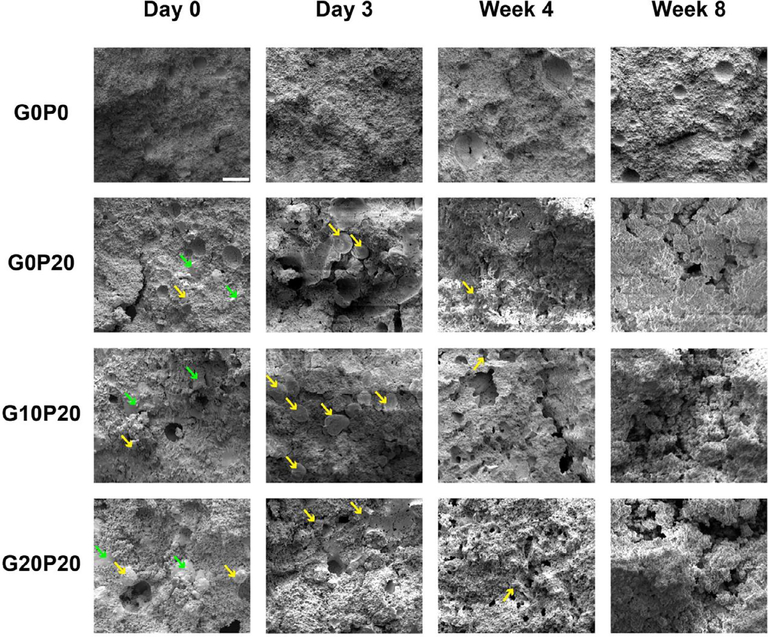
Fig. 3.
Representative scanning electron microscopy (SEM) images showing the internal morphology of composites upon fabrication (Day 0) and after being leached in PBS at 37 °C for 3 days, 4 wks, and 8 wks. G0P0 represents the control. GMPs were introduced in three different weight fractions (0, 10, and 20%) and represented by groups G0P20, G10P20, and G20P20, respectively. The smooth spherical particles annotated by a yellow arrow represent PLGA MPs, while the jagged irregular particles marked with a green arrow represent GMPs. The white scale bar in the image in row 1 column row 1 represents 100 μm in all micrographs. (For interpretation of the references to colour in this figure legend, the reader is referred to the web version of this article.)

