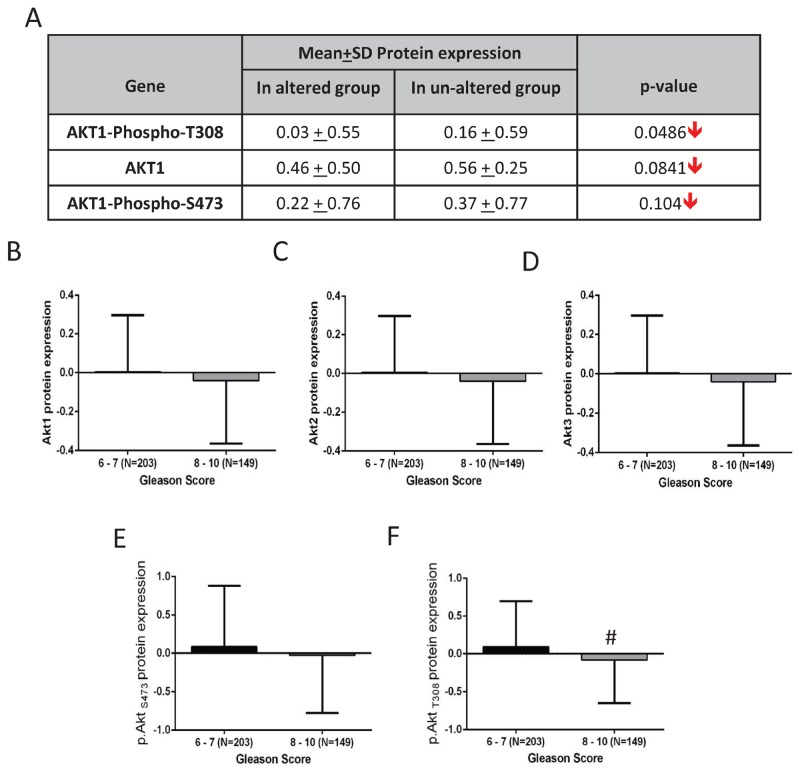
FIGURE 7. Alterations in Akt1 protein expression and its activity in human primary prostate adenocarcinoma.
(A) Chart showing a decline in the mean protein expression of Akt1, p.AktS473 and p.AktT308 in the PCa tissues with observed Akt pathway alterations compared to the un-altered group based on the analysis by the cancer genome atlas research network (TCGA, Cell, 2015). (B-F) Patients stratification based on Gleason score [higher (8-10) and lower (6-7) group] showed a declining trend in Akt1, Akt2, Akt3, p.AktS473 and a significant reduction in p.AktT308 protein/phosphorylation levels in the higher compared to the lower Gleason score group. #P < 0.01; Unpaired Student t-test for two group analysis (GraphPad Prism 6.01). Data are presented as means ± SD.

