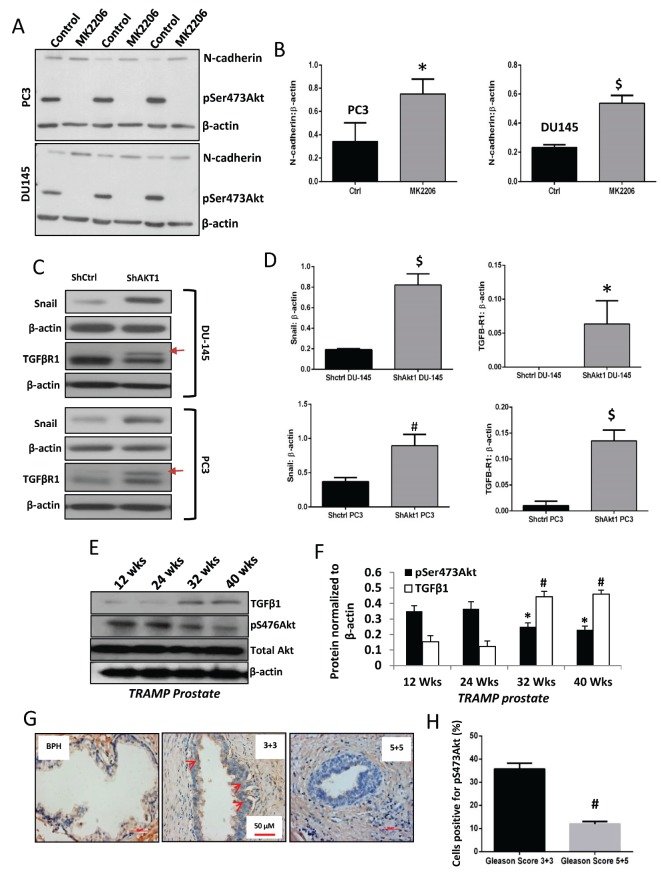
FIGURE 8. A decrease in Akt phosphorylation (activity), not expression is linked to EMT in PCa.
(A) Representative Western blot images of PC3 and DU145 cell lysates treated with DMSO (control) or Akt inhibitor MK2206 for 72 hours (5 μM) showing changes in the phosphorylation of Akt associated with changes in the expression of mesenchymal marker N-cadherin. (B) Bar graphs showing changes in N-cadherin expression in PC3 and DU145 cells with MK2206 treatment (n=3). (C) Representative Western blot images of PC3 and DU-145 ShControl and ShAkt1 cell lysates showing changes in the expression of TGFβ-R1 and mesenchymal transcription factor Snail. (D) Representative bar graph of band densitometry analysis for TGFβR1 and Snail1 of PC3 and DU-145 ShControl and ShAkt1 cell lysates (n=3). (E-F) Western blot images and band densitometry analysis of TRAMP prostate lysates collected from 12, 24, 32 and 40 wks-old mice, and analyzed for changes in pS473Akt and TGFβ1 expressions, showing an inverse relationship between pS473Akt (decreased) and TGFβ1 (increased) in the high-grade tumor (n=4). (G-H) Immunohistochemistry of early stage PCa (Gleason 3+3) showing a higher number of phosphorylated Akt (pSer473, active) positive cells compared to the advanced stage (Gleason 5+5) (n=5) as counted using Image-J software and percentage of pAkt-positive cells were determined. *P<0.01 compared to pS473Akt on 12 wks; #P>0.01 compared to TGFβ1 on 12 wks. $P < 0.01; Unpaired Student t-test for two groups analysis (GraphPad Prism 6.01). Data are presented as means ± SD.

