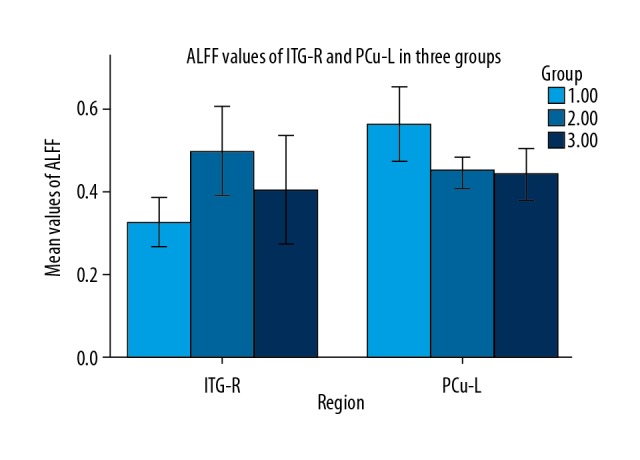
Figure 3.

ALFF values of PCu_L and ITG_R. The different brain-regions, ALFF values were demonstrated on horizontal axis and vertical axis, respectively. Light gray represented the recordings for NC group. Dark gray represented the recordings for the LA-VaD group. Black represented the recordings for the LA-VaMCI group. ALFF – amplitude of low-frequency fluctuations; PCu_L – left precuneus; ITG_R – right inferior temporal gyrus; NC – normal control; LA – leukoaraiosis; VaMCI – vascular mild-cognitive impairment; VaD – vascular-dementia.
