
Figure 4.
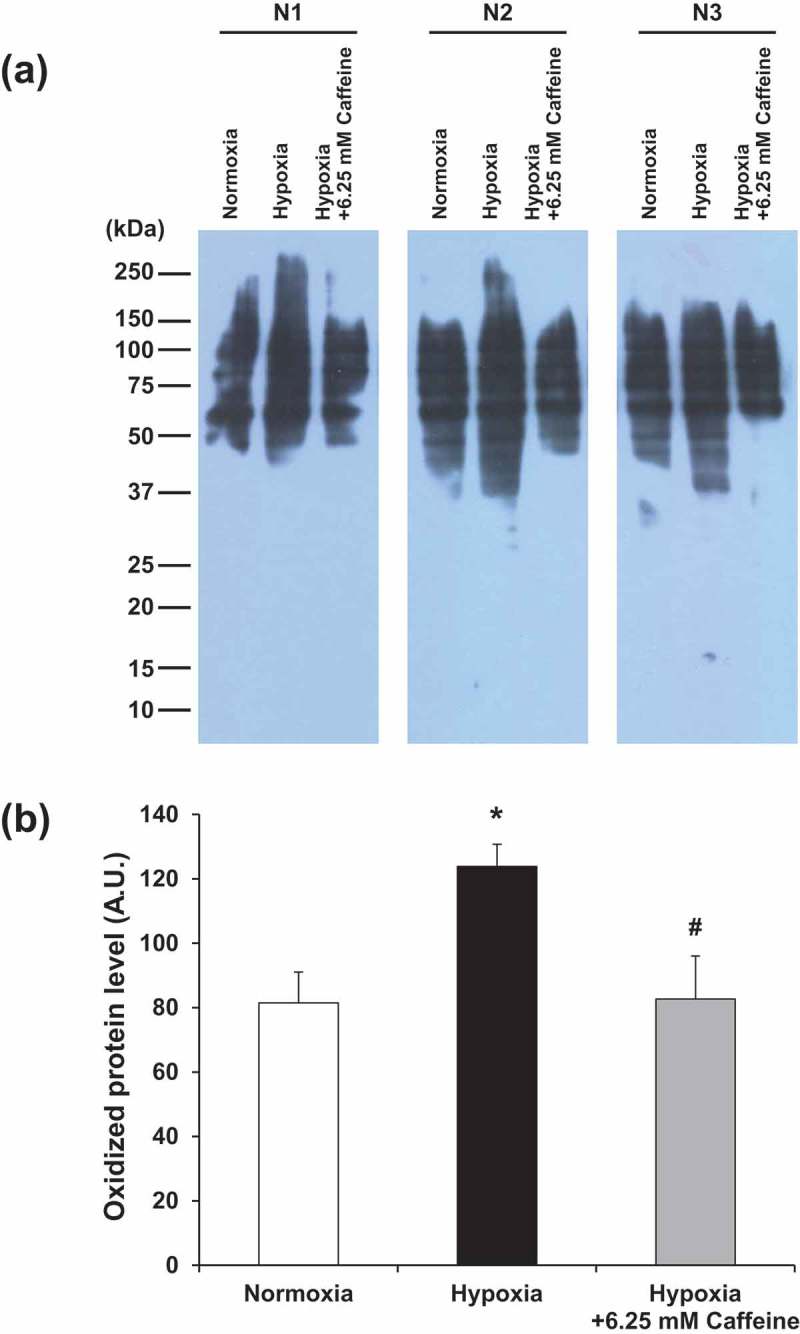
Effect of hypoxia and caffeine on levels of oxidized proteins. (a) Oxidized protein levels were determined by OxyBlot assay. (b) Quantitative analysis of band intensity of the oxidized proteins detected in each condition. Each bar represents the mean ± SEM of the data derived from three independent biological replicates. *p < 0.05 vs. control (normoxia); #p < 0.05 vs. hypoxia.