
Figure 7.
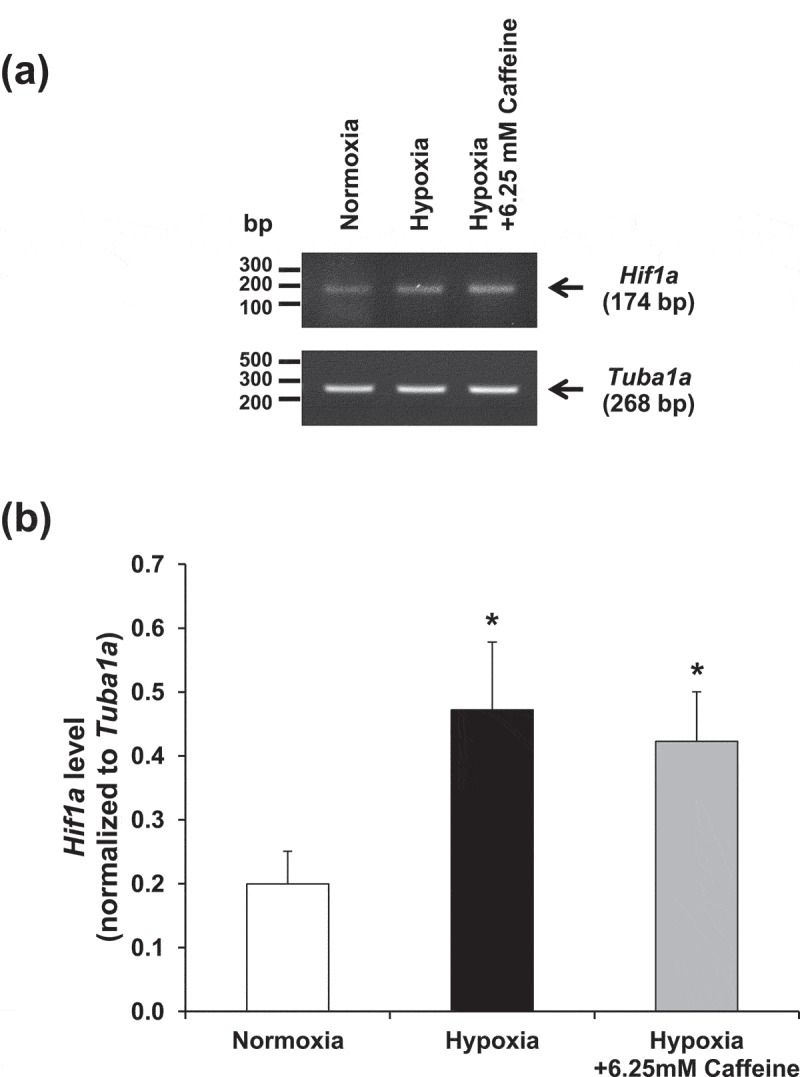
Effect of hypoxia and caffeine on Hif1a gene. (a) Hif1a mRNA expression level was examined by semi-quantitative RT-PCR. (b) Quantitative analysis of band intensity of Hif1a mRNA detected in each condition. Each bar represents the mean ± SEM of the data derived from three independent biological replicates. *p < 0.05 vs. control (normoxia).