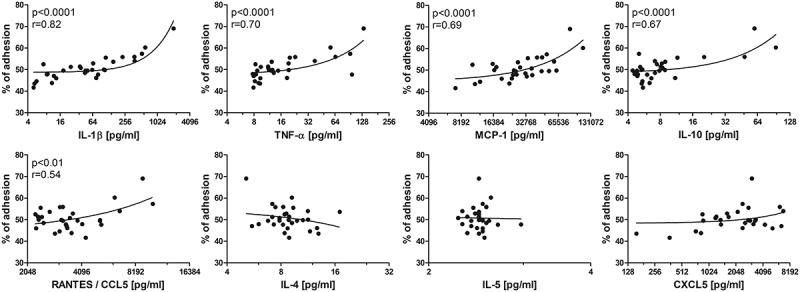
Figure 2.

Correlation of the level of adhesion to cytokine concentrations in ATCM.
The X-axis has a log2 scale. IL-1β/4/5/10 – interleukin 1β/4/5/10, TNF-α – tumour necrosis factor α, MCP-1 – monocyte chemoattractant protein-1 (CCL2), RANTES – CCL5 – regulated the activation, normal T cell expression and secretion.
