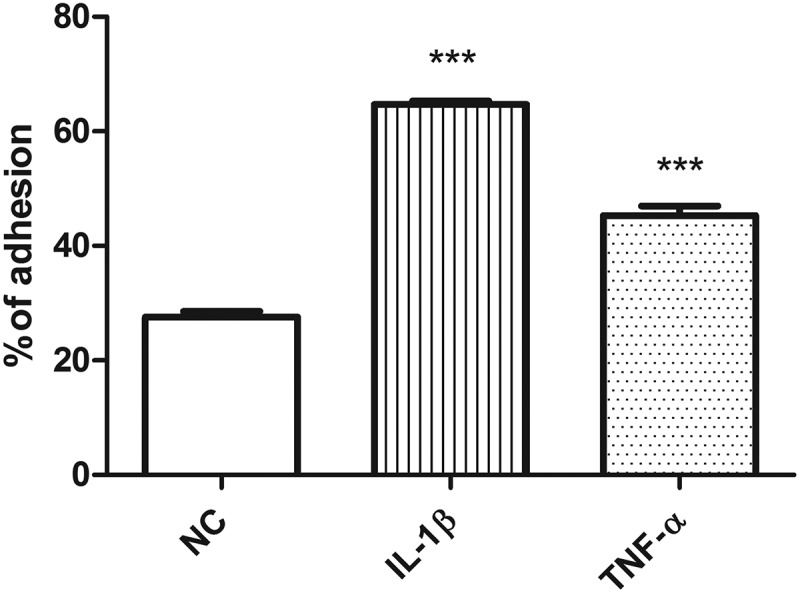
Figure 3.

Stimulation of endothelial cells by IL-1ß and TNF-α at concentrations measured in ATCM.
IL-1ß (200 pg/ml) and TNF-α (30 pg/ml). NC – negative control, IL-1ß – interleukin 1ß, TNF-α – tumor necrosis factor α, * p < 0.05, *** p < 0.001.

Stimulation of endothelial cells by IL-1ß and TNF-α at concentrations measured in ATCM.
IL-1ß (200 pg/ml) and TNF-α (30 pg/ml). NC – negative control, IL-1ß – interleukin 1ß, TNF-α – tumor necrosis factor α, * p < 0.05, *** p < 0.001.