. 2019 Jun 24;8:e46349. doi: 10.7554/eLife.46349

Figure 1. Subluminal mesenchymal cells of postnatal uteri retain expression of Misr2.

(A) RNAish (RNA scope) analysis of Misr2 in transverse sections of male urogenital ridges at E 17.5, and in a time series of the developing uteri including E 18.5, E 19.5, PND 0, 2, and 6 in mice). Scale bars = 50 µm (n = 8 for<PND6; n = 4 for>PND6). Number of mice analyzed per time point is presented in Figure 1—source data 1. Black arrows demarcate to the myometrial layer at PND 20. (B) Representative scheme of the Misr2 expression pattern in the developing uterus. Subluminal mesenchymal cells continue to express Misr2 in the postnally until around PND 6. We sought to investigate the fate of these postnatal Misr2+ subluminal cells, and their possible role as progenitor cells of the endometrial stroma.

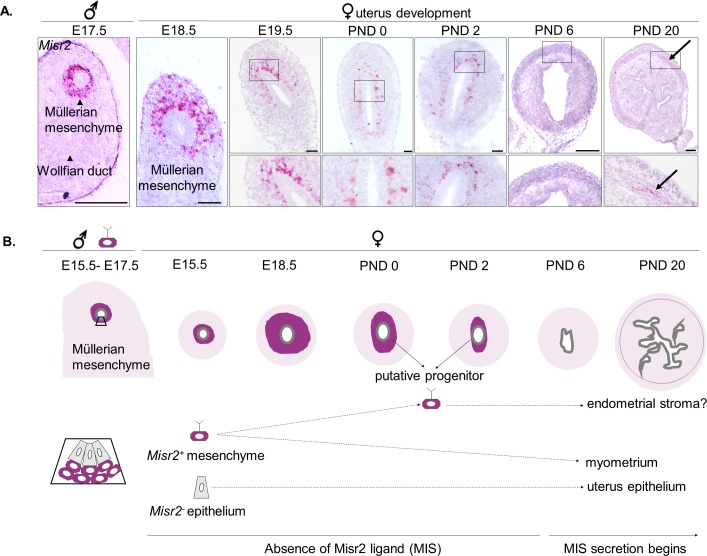
Figure 1—source data 1. Number of replicates per time point for the Misr2 in situ analysis in mice (Figure 1A) and in rats (Figure 1—figure supplement 1D–E).
DOI: 10.7554/eLife.46349.005

Figure 1.

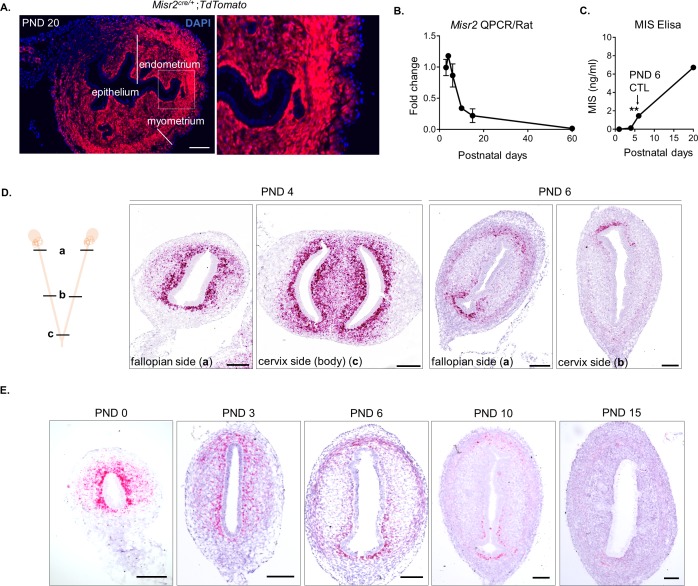
Figure 1—figure supplement 1. Misr2 expression is gradually attenuated in the PND 1-6 period, coinciding with the timing of the rise in secretion of MIS.

Figure 1—figure supplement 1.

(A) Uteri from Misr2-cre-tdtomato mice were analyzed on PND 20. Scale bar = 50 µm. Note that all the layers of the adult uterus except the epithelium are derived from Misr2+ cells during early embryonic development. (B) Misr2 QPCR analysis of the developing rat uteri at PND 3, 4, 6, 10, 15, and 60. (C) Endogenous MIS (MISR2 ligand) levels were measured in the serum of wild-type rats at PND 1, 4, 6 and 20 by ELISA (left) (n > 2), mean ± SEM, statistical significance indicated by ** (p<0.01) by one-way ANOVA followed by Tukey Multiple comparison test. (D) Misr2 expression pattern from the fallopian side (a) and the cervix side (b) of the developing uteri (PND 4 and PND 6) in rats. Note that the Misr2 expression pattern is consistently subluminal in proximal and distal transverse locations of the uterine horn. Scale bars = 50 µm. E. RNAish (RNA scope) of Misr2 in middle transverse sections in a time series of the developing rat uteri including PND 0, 2, 3 and 6 in rats. Scale bars = 50 µm (n = 8 for<PND 6; n = 5 for>PND 6). Number of replicates per time point is presented in Figure 1—source data 1. Rats were used as the model organism to replicate the findings observed in mice tissue sections in Figure 1A.