. 2019 Jun 24;8:e46349. doi: 10.7554/eLife.46349

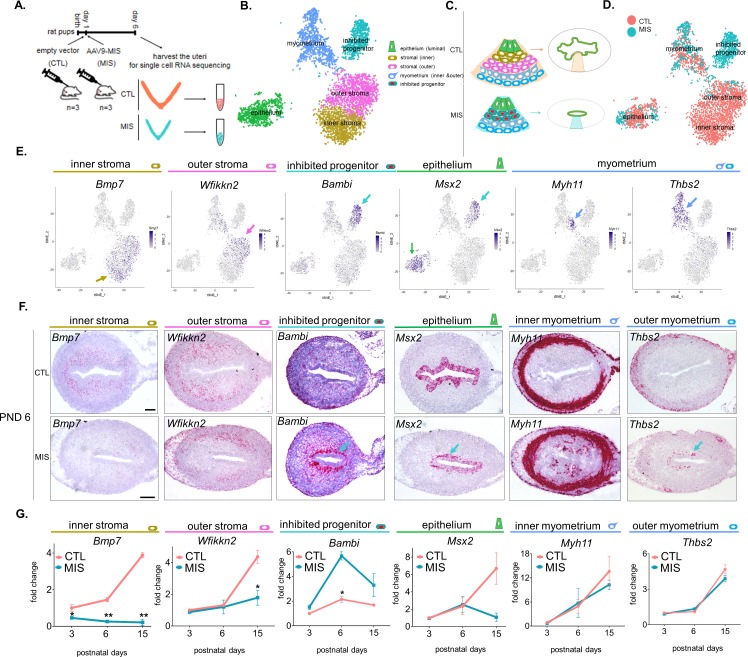
Figure 3. Single cell RNA sequencing of PND 6 uteri reveals distinct cell types and unique gene signatures in response to MIS treatment.

(A) Rat pups were treated with empty vector control (CTL) or AAV9-MIS (MIS) on PND 1, and euthanized on PND 6 (n = 3 for both). Following whole-tissue dissociation, RNA isolated from single uterine cells, were barcoded and sequenced using inDROP. (B) t-SNE plot of unbiased clustering of uterine cells, where each color-coded cluster represents one cell type/state (only the main uterine parenchymal clusters are represented) (Figure 3—source data 1). (C) Schematic representation of the differential cellular composition of control and MIS-treated uteri. (D) t-SNE plot of unbiased clustering of uterine cells (dots) color-coded by treatment with CTL (orange) and MIS (blue) (Figure 3—source data 1). (E) Gene expression levels of representative cell-type-specific markers for each cluster overlaid on t-SNE plots (featureplot, color-coded arrow refers to cell type). (F) RNAish stains of representative cell-type markers in transverse uterine sections of empty vector control (CTL) and AAV9-MIS (MIS) treated mice at PND 6. Scale bars = 100 µm, same for all sections. Mouse tissues were used for validation purposes as the RNA in situ probes were readily available for mice and the effect of MIS was conserved among mice and rats. (G) Rat pups treated with AAV9-MIS (MIS) or empty vector (CTL) on PND 1 were euthanized at different developmental time points (PND3, 6, and 15), and their uteri were harvested for QPCR analysis of one representative marker for each cluster (n > 2, unpaired Student’s t test, mean ± SEM, *(p<0.05), **(p<0.01)) (Figure 3—source data 3).

Figure 3—source data 1. Related to Figure 3; Figure 3—figure supplements 1, 2, 3 and 4; Figure 4, Figure 4—figure supplements 1, 2 and 3 and Table 1.
DOI: 10.7554/eLife.46349.014
Figure 3—source data 2. Differentially expressed genes (MIS vs Control) in the myometrium of the developing rat uteri.
DOI: 10.7554/eLife.46349.015
Figure 3—source data 3. Related to Figure 3G, Figure 4—figure supplements 1D,3D,4E.
First worksheet presents the sets of primers used in this study. Second worksheet presents the statistics for the QPCRs experiments: Number of replicates and p values of significance between the control and treated uterine samples for the Quantitative PCR experiments.
DOI: 10.7554/eLife.46349.016

Figure 3.

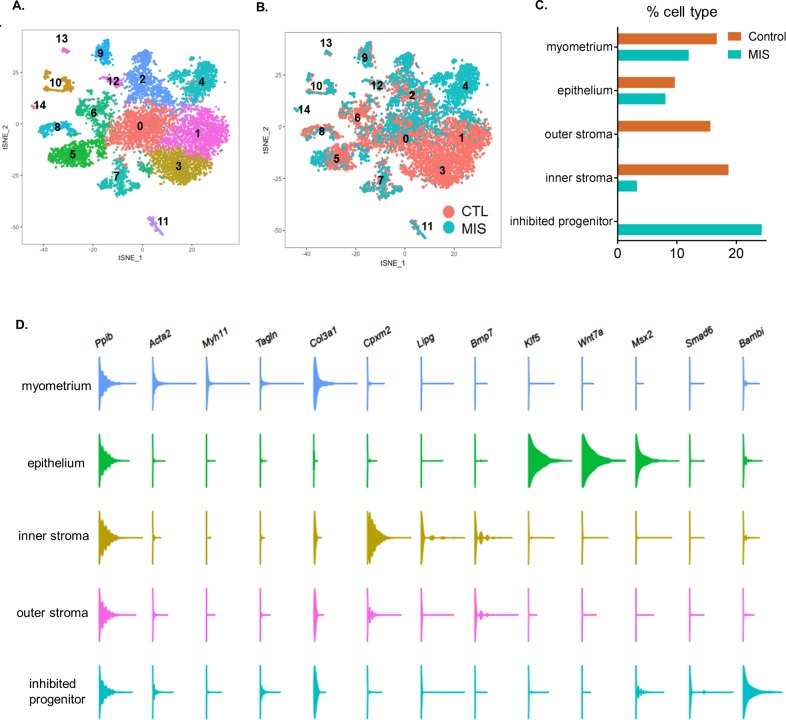
Figure 3—figure supplement 1. Single-cell RNA sequencing analysis of the control and AAV9-MIS treated rat uterine cells.

Figure 3—figure supplement 1.

(A) Rat pups were treated with empty vector control (CTL) or AAV9-MIS (MIS) on PND1, and euthanized on PND 6 (n = 3 for both). t-SNE plot displaying the results of unbiased clustering of single uterine cells, where each color-coded cluster represents one cell type/state (all clusters included). Labels are as follows: 0: censored, 1: outer stroma, 2: myometrium, 3: inner stroma, 4: inhibited cluster, 5: luminal epithelium, 6: dividing cells, 7: vascular endothelium, 8: dividing epithelium, 9: mesothelium, 10: myeloid, 11: erythroid, 12: pericyte, 13: lymphatic endothelium, 14: neurons (Figure 3—source data 1). (B) t-SNE plot displaying the clustering of single uterine cells where each dot/cell is color-coded according to treatment, either CTL (orange) or MIS (blue) (all clusters included) (Figure 3—source data 1). (C) Relative percentage of representation of cells by clusters based on treatment (CTL, orange and MIS, blue) in the main parenchymal uterine cell types (only the main uterine cell types are shown in Figure 3B). (D) Gene expression levels of selected markers in the main parenchymal uterine cell types.
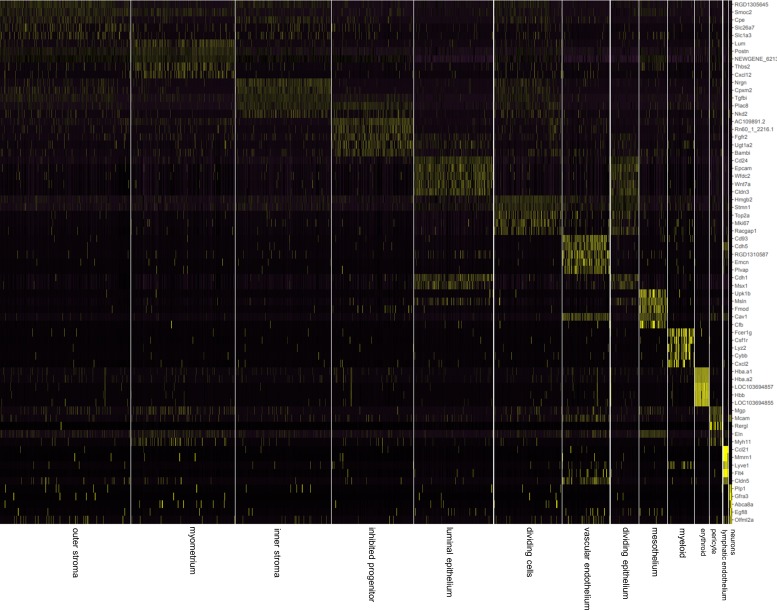
Figure 3—figure supplement 2. Single-cell RNA-seq reveals the cell atlas of the developing PND6 uterus.

Figure 3—figure supplement 2.

Heatmap of top five markers (showing top five genes by fold expression over average) amongst 14 different clusters (Figure 3—source data 1).
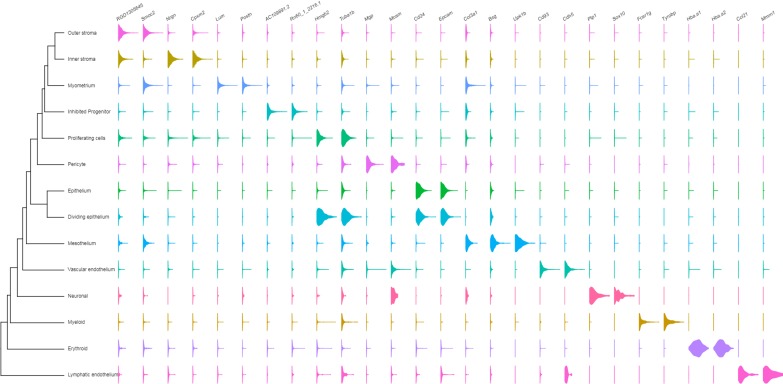
Figure 3—figure supplement 3. Single-cell RNA-seq reveals the cell atlas of the developing PND 6 uterus.

Figure 3—figure supplement 3.

Violin plots of the top two marker genes revealed by highest p values (Figure 3—source data 1 and Table 1).
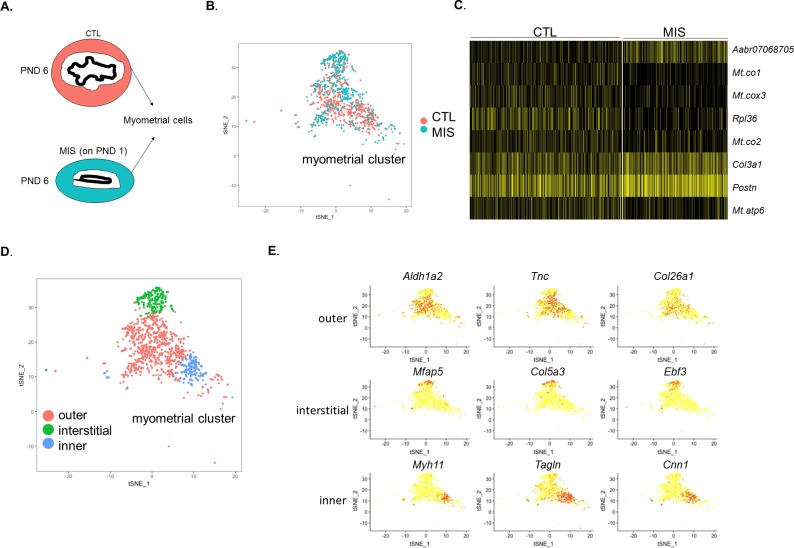
Figure 3—figure supplement 4. The myometrium cluster can be sub-divided into three different cell types whose gene signatures are only weakly affected by MIS treatment.

Figure 3—figure supplement 4.

Rat pups were injected with empty vector control (CTL) or AAV9-MIS (MIS) on PND 1 and analyzed by scRNAseq at PND 6 (A–E). (A) Representative schema of the myometrial layer composition in control (orange) and MIS-treated (blue) uteri. (B) t-SNE plot of the myometrial cluster with cells labeled according to treatment. Note that both the CTL and the MIS-treated cells are numerically and spatially similarly represented in the t-SNE plot. (C) Heatmap of differentially expressed genes in CTL and MIS-treated myometrium (Figure 3—source data 2). (D) Sub-clustering of the myometrium cluster revealed three distinct myometrial sub-populations in the developing PND 6 rat uteri. (E) Specific markers for the three cell subtypes (outer, interstitial (microfibril enriched), and inner) of the developing rat myometrium.