. 2019 Jul 3;8:e45303. doi: 10.7554/eLife.45303

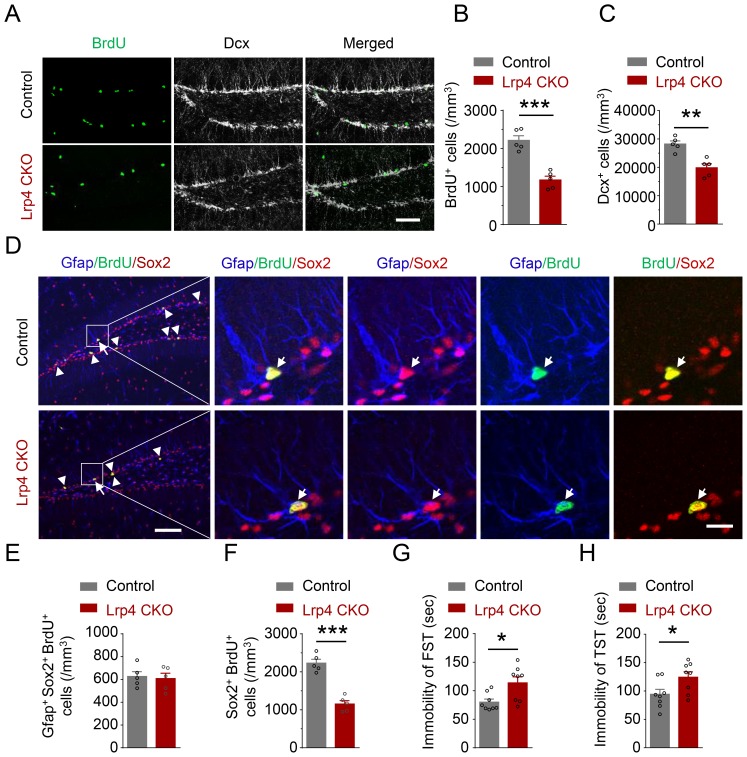
Figure 3. Reduced NSPCs proliferation and increased immobility of Lrp4 CKO mice.

(A–C) Reduced numbers of BrdU- and Dcx-labeled cells in Lrp4 CKO SGZ. (A) Representative images. Scale bar, 100 μm. (B–C) Stereological quantification of SGZ BrdU+ (B) and Dcx+ (C) cells. n = 5 for each group. Student’s t-test: t (8)=6.602, p=0.0002 for BrdU; t (8)=4.701, p=0.0015 for Dcx. (D–F) Reduced NPCs proliferation in Lrp4 CKO. (D) Representative images. The arrow indicated Gfap+/BrdU+/Sox2+, while the arrow head indicated BrdU+/Sox2+ cells. Scale bar, left 100 µm, right 20 µm. (E) Similar numbers of SGZ Gfap+Sox2+ BrdU+ NSCs between the two genotypes. n = 5 for each group. Student’s t-test: t (8)=0.2947, p=0.7757. (F) Decreased the density of Sox2+BrdU+ NPCs in Lrp4 CKO mice, compared with control. n = 5 for each group. Student’s t-test: t (8)=7.943, p<0.0001. (G–H) Increased duration of immobility in FST (G) and TST (H) of Lrp4 CKO mice, compared with control. n = 8 for each group. Student’s t-test: t (14)=2.826, p=0.0135 for FST; t (14)=2.332, p=0.0352 for TST. Data are mean ± s.e.m; *, p<0.05; **, p<0.01; ***, p<0.001.

Figure 3—source data 1. Reduced adult neurogenesis and increased immobility of Lrp4 CKO mice.
DOI: 10.7554/eLife.45303.010
Figure 3—source data 2. Characterization of Lrp4 CKO mice.
DOI: 10.7554/eLife.45303.011
Figure 3—source data 3. Similar number of cleaved caspase-3 labeled cells between Lrp4 CKO and control mice.
DOI: 10.7554/eLife.45303.012

Figure 3.

Figure 3—figure supplement 1. Generation and characterization of Lrp4 mutant mice.

Figure 3—figure supplement 1.

(A) Lrp4f/f mice were crossed with hGFAP-Cre mice; resulting GFAP-Cre::Lrp4f/+ were crossed with Lrp4f/f mice to generate hGFAP-Cre::Lrp4f/f (Lrp4 CKO) and Lrp4f/+ or Lrp4f/f (control). (B) Reduced Lrp4 mRNA in Lrp4 CKO hippocampus, compared with control. n = 3 for each group. Student’s t-test: t (4)=15.76, p<0.0001. (C–D) Reduced Lrp4 protein in Lrp4 CKO hippocampus, compared with control. n = 3 for each group. Student’s t-test: t (4)=10.49, p=0.0005. Data are mean ± s.e.m. ***, p<0.001.
Figure 3—figure supplement 2. Similar number of cleaved caspase-3 labeled cells between Lrp4 CKO and control mice.

Figure 3—figure supplement 2.

(A) Representative images. Scale bar, left 50 µm, right 5 µm. (B) Quantitative data. n = 3 for each group. Student’s t-test: t (4)=0.2427, p=0.8202. Data are mean ± s.e.m; ns, p>0.05.