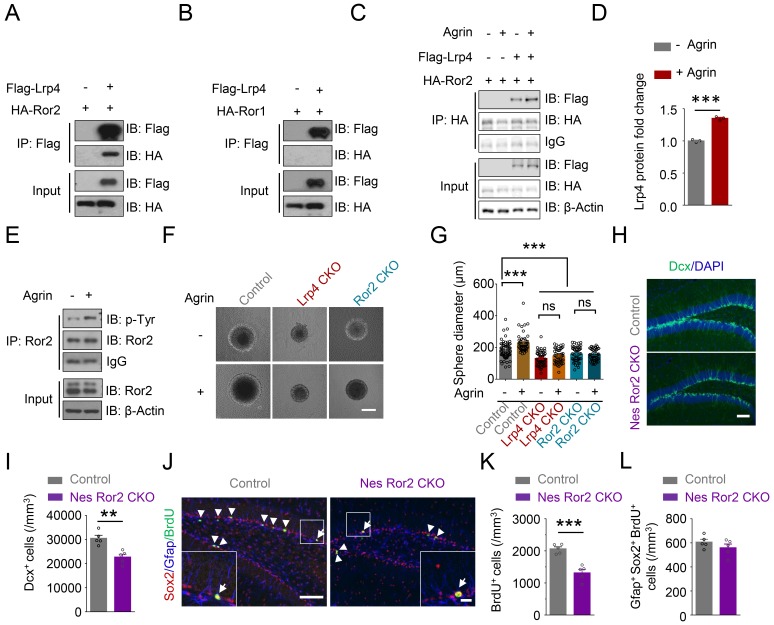
Figure 6. Requirement of Ror2 for adult neurogenesis.
(A–B) Co-immunoprecipitation Ror2 (A), not Ror1 (B), with Lrp4 in co-transfected HEK293T cell. (C–D) Increased Lrp4-Ror2 interaction in Agrin-treated HEK293T cell. (D) Quantitative analysis of data of C. Lrp4 intensity was normalized by that of IgG. Student’s t-test: t (4)=18.47, p<0.0001. (E) Increased Ror2 tyrosine phosphorylation in Agrin-treated neurosphere. Three independent experiments were performed. (F–G) Increased neurosphere size by Agrin and blockade by Lrp4 or Ror2 mutation. (F) Representative images. Scale bar, 100 µm. (G) Quantification of neurosphere size. One-way ANOVA test: F (5,314)=28.55, p<0.0001. Three independent experiments were performed. (H–I) Decreased Dcx+ cell density in Nes Ror2 CKO mice, compared with control. (H) Representative images. Scale bar, 100 µm. (I) Stereological quantification of Dcx+ cell density. n = 5 for each group. Student’s t-test: t (8)=4.523, p=0.0019. (J–L) Reduced BrdU+ cell density in Nes Ror2 CKO mice, compared with control. (J) Representative images. Scale bar 100 µm. (K) Stereological quantification of BrdU+ cell density. n = 5 for each group. Student’s t-test: t (8)=5.948, p=0.0003. (L) Similar density of SGZ Gfap+Sox2+ BrdU+ NSCs between the two genotypes. Student’s t-test: t (8)=1.22, p=0.2572. Data are mean ± s.e.m. **, p<0.01; ***, p<0.001.


