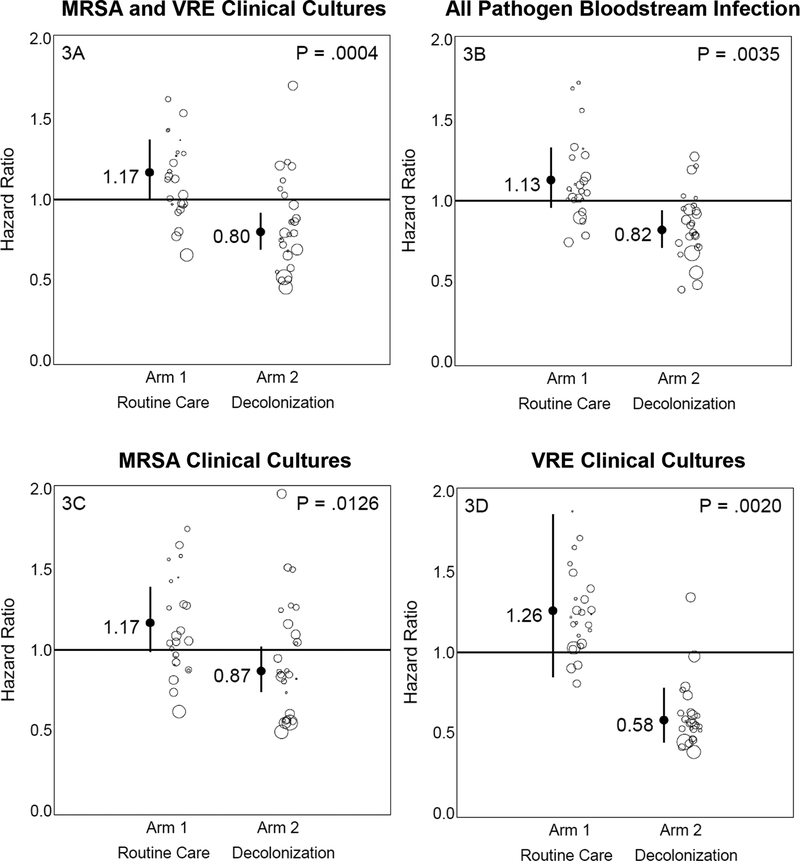
Figure 3. Outcomes in Patients with Devices.
Graphic showing impact of trial interventions on trial outcomes in the post-hoc subpopulation of patients with devices. Arm-specific hazard ratios and confidence intervals from proportional hazards models (intent-to-treat, unadjusted) accounting for clustering by hospitals are shown for MRSA or VRE clinical cultures (3A), all-pathogen bloodstream infection (3B), MRSA clinical cultures only (3C), and VRE clinical cultures only (3D). Results remained significant after adjusting for multiple comparisons. Bubble plots of hazard ratios (predicted random effects or exponentiated frailties) from individual hospitals relative to their arm effects are shown adjacent to arm-specific hazard ratios and confidence intervals. The size of the bubble reflects the relative number of patients contributing data to the subpopulation.
NOTE: Change in figure due to extending p-values out to 4 digits. Hard to track changes.

