Figure 5.
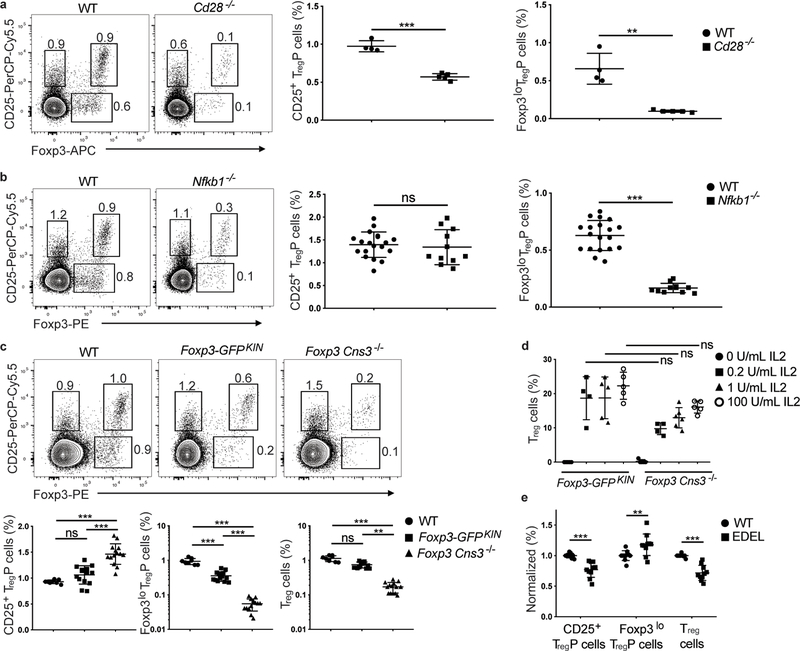
Foxp3lo TregP cells are dependent on NFκB1 activation and the Foxp3 regulatory element Cns3. a), Left panels, shown are representative flow cytometry plots for CD4+CD8−CD73− gated thymocytes antibodies from wild-type and Cd28−/− mice stained with antibodies to CD25 and Foxp3 (1 experiment, n=4 wild-type and 5 Cd28−/− mice). Right panels show cumulative data for all mice and depict the relative percentage of CD25+ TregP and Foxp3lo TregP in CD4+CD8−CD73− thymocytes from wild-type and Cd28−/− mice. b), Shown are representative flow cytometry plots for CD4+CD8−CD73− gated thymocytes from wild-type and Nfkb1−/− mice stained with antibodies to CD25 and Foxp3 (3 independent experiments, n=19 wild-type and 11 Nfkb1−/− mice). Right panels show cumulative data for all mice and depict the relative percentage of CD25+ TregP and Foxp3lo TregP in CD4+CD8−CD73− thymocytes from wild-type and Nfkb1−/− mice c) Top panels, shown are representative flow cytometry plots for CD4+CD8−CD73− gated thymocytes from wild-type, FOXP3-GFPKIN, and Cns3−/− mice stained with antibodies to CD25 and Foxp3 (4 independent experiments, n=8 wild-type, 14 Foxp3-GFPKIN, and 14 Cns3−/− mice). Right panels show quantification of cumulative data for all mice and depict relative percentage of CD25+ TregP and Foxp3lo TregP in CD4+CD8−CD73− thymocytes from wild-type (black circles), Foxp3-GFPKIN (black squares), and Cns3−/− (black triangles) mice. d) Shown are the percentages of CD25+Foxp3+ mature Treg cells generated after stimulating sorted CD4+CD8−CD73−CD25+ TregP cells from thymi of Foxp3-GFPKIN and Cns3−/− mice for 3 days with 0 U/ml IL2 (black circles, n=5 Foxp3-GFPKIN and 5 Cns3−/− mice), 0.2 U/ml IL2 (black squares, n=4 Foxp3-GFPKIN and 5 Cns3−/− mice), 1 U/ml IL2 (black triangles, n=5 Foxp3-GFPKIN and 6 Cns3−/− mice) and 100 U/ml (open circles, n= Foxp3-GFPKIN and 5 Cns3−/− mice) and come from 2 independent experiments. e) Quantification of cumulative data from 2 independent experiments showing the relative percentage of CD25+ TregP, Foxp3lo TregP and mature CD25+Foxp3+ Treg cells from CD4+CD8−CD73− gated thymocytes from wild-type (black circles) or EDEL mice, which lack the CaRE4 enhancer (black squares). Data represents 2 independent experiments, n=10 wild-type and 10 EDEL mice. a,b) Data was analyzed by two-sided unpaired t test. c) CD25+ TregP cells (%) and Foxp3lo TregP cells (%) were analyzed by one-way ANOVA with Tukey’s multiple comparison test and Treg cells (%) was analyzed by Kruskal-Wallis test with Dunn’s multiple comparison test. d) Data was analyzed by Kruskal-Wallis test with Dunn’s multiple comparisons test. e) Data was analyzed by two-way ANOVA with Sidak multiple comparisons test. All data are displayed as mean ± standard deviation. **P<0.005, ***P<0.0001, ns- not significant.

