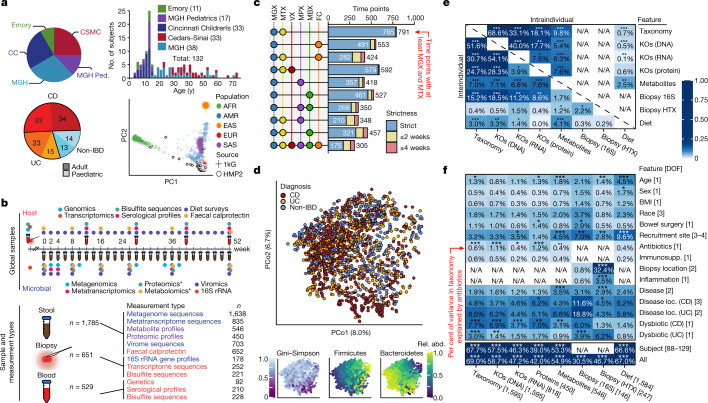
Fig. 1. Multi-omics of the IBD microbiome in the IBDMDB study.
a, Overview of cohort characteristics. We followed 132 participants (with CD, with UC, or without IBD (control)) for one year each. Principal component analysis (PCA) of SNP profiles shows that the resulting IBDMDB cohort is mostly of European ancestry as compared to the 1000 Genomes (1kG) reference (see Methods). b, Sampling strategy. The study yielded host and microbial data from colon biopsy (baseline), blood (approximately quarterly), and stool (every two weeks), assessing global time points for all subjects and dense time courses for a subset. Raw, non-quality-controlled sample counts are shown. c, Overlap of multi-omic measurements from the same sample (strict) or from near-concordant time points (with differences of up to 2 or 4 weeks; see Methods). d, Principal coordinates analysis (PCoA) based on species-level Bray–Curtis dissimilarity; most variation is driven by a tradeoff between phylum Bacteroidetes versus Firmicutes. Samples from individuals with IBD (CD in particular) had weakly lower Gini–Simpson alpha diversity (Wald test P = 0.26 and 0.014 for UC and CD compared with non-IBD, respectively). e, Mantel tests quantifying variance explained (square of Mantel statistic) between measurement type pairs, with differences across subjects (inter-individual) or within subjects over time (intra-individual; see Methods); results show tight coupling across measurement types. Sample sizes in f. f, PERMANOVA shows that inter-individual variation is largest for all measurement types, with even relatively large effects (for example, antibiotics or IBD phenotype) capturing less variation (see Methods). Stratified tests (CD/UC) consider only samples within the indicated phenotype (note that sample counts decrease for these, resulting in larger expected covariation by chance). Stars show FDR-corrected statistical significance (FDR *P ≤ 0.05, **P ≤ 0.01, ***P ≤ 0.001). Variance is estimated for each feature independently (Methods). ‘All’ refers to a model with all metadata. Total n for each measurement type is shown in square brackets, distributed across up to 132 subjects (Extended Data Fig. 1a, see Methods).

