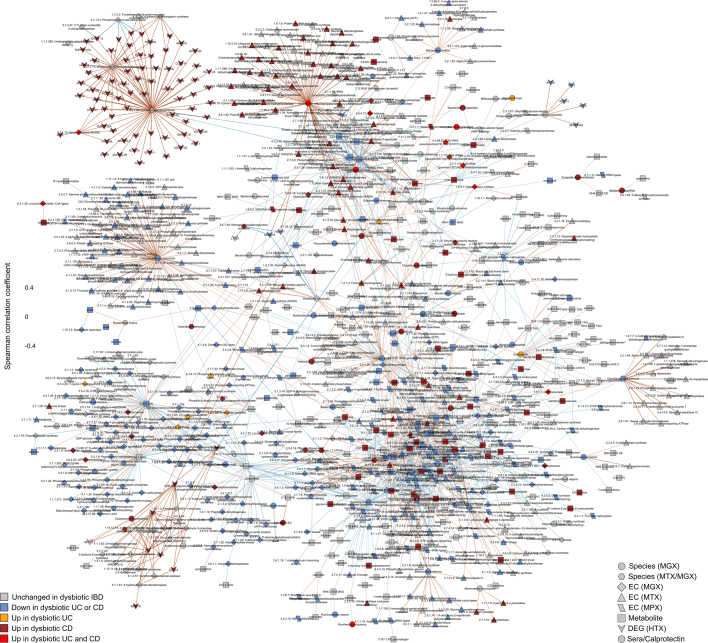
Extended Data Fig. 9. Significant covariation among multi-omic components of the gut microbiome and host interactors in IBD (unadjusted).
The network was constructed from ten data sets: metagenomic species, species-level transcription ratios, functional profiles at the EC levels (MGX, MTX and MPX), metabolites, host transcription (rectal and ileal separately), serology and faecal calprotectin. As in Fig. 4c, measurement types were approximately matched in time with a maximum separation between paired samples of four weeks. The top 300 significant correlations (FDR P < 0.05) among correlations between features that were differentially abundant in dysbiosis were used to construct the network visualized here (for serology, a threshold of FDR P < 0.25 was used). Nodes are coloured by the disease group in which they are ‘high’, and edges are coloured by the sign and strength of the correlation. For this unadjusted network, Spearman correlations were calculated using HAllA from the residuals of the same model as in Extended Data Fig. 8, though without adjusting for dysbiosis (see Methods). Appropriate normalization and/or transformation for each measurement type was performed independently before the model fitting (see Methods). Singleton node pairs were pruned from the network. Source associations are in Supplementary Table 36, sample counts in Fig. 1b, c.

