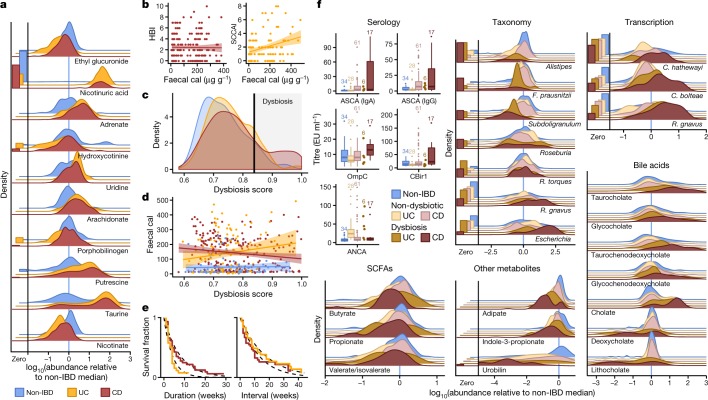
Fig. 2. Metagenomic, metatranscriptomic, and stool metabolomic profiles are disrupted during IBD activity.
a, Relative abundance distributions for ten of the most cross-sectionally significantly differentially abundant metabolites in samples from individuals with IBD, as a ratio to the median relative abundance in individuals without IBD (Wald test; all FDR P < 0.003; see Methods; Supplementary Tables 1–14). Left, fraction of samples below detection limit (see Methods). n = 546 samples from 106 subjects. b, Relationships between two measures of disease activity: patient-reported (Harvey–Bradshaw index (HBI) in CD, n = 680 samples from 65 subjects; simple clinical colitis activity index (SCCAI) in UC, n = 429 samples from 38 subjects) and host molecular (faecal calprotectin (cal)43, n = 652 samples from 98 subjects). Linear regression shown with 95% confidence bound. c, d, Distribution of microbial dysbiosis scores as a measure of disease activity (c, median Bray–Curtis dissimilarity between a sample and non-IBD samples; see Methods) and its relationship with calprotectin (d, n = 652 samples from 98 subjects). Linear regression with 95% confidence. e, Kaplan–Meier curves for the distributions of the durations of (left) and intervals between (right) dysbiotic episodes in UC and CD. Both are approximately exponential (fits in dashed lines), with means of 4.1 and 17.2 weeks, respectively, for UC, and 7.8 and 12.8 weeks for CD (see Methods). f, Relative abundance distributions of significantly different metagenomic species (n = 1,595 samples from 130 subjects), metabolites (n = 546 samples from 106 subjects), and microbial transcribers (n = 818 samples from 106 subjects) in dysbiotic samples compared to non-dysbiotic samples from the same disease group (Wald test; all FDR P < 0.05; full results in Supplementary Tables 15–28). Also shown are antibody titres for ANCA, ASCA (IgG or IgA), anti-OmpC, and anti-CBir1 antibodies (n = 146 samples from 61 subjects). Boxplots show median and lower/upper quartiles; whiskers show inner fences; sample sizes above boxes.

