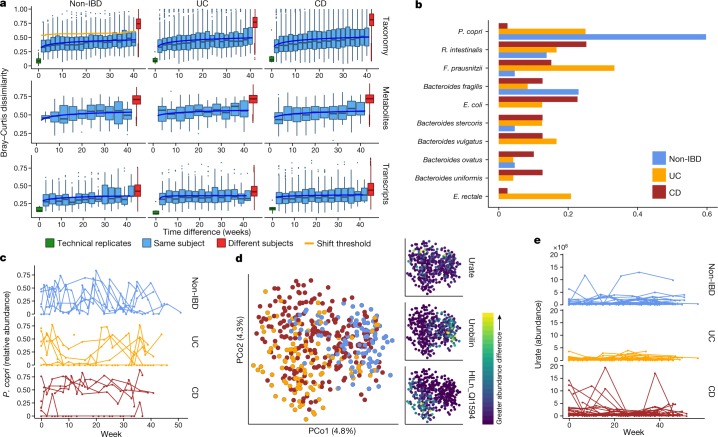
Fig. 3. Temporal shifts in the microbiome are more frequent and more extreme in IBD.
a, Bray–Curtis dissimilarities within subjects as a function of intervening time difference, as compared to different people or technical replicates; calculated for metagenomic taxonomic profiles (species; n = 1,595 samples from 130 subjects), metabolomics (n = 546 samples from 106 subjects), and functional profiles (KO30 gene families; n = 818 samples from 106 subjects). Boxplots show median and lower/upper quartiles; whiskers show inner fences. Blue, least-squares power-law fits; orange, thresholds for microbiome shifts (see Methods). Proteomics and species-level transcripts in Extended Data Fig. 5a. Within-subject changes are significantly more extreme in UC and CD than in non-IBD for taxonomic profiles (F-test P = 3.9 × 10⁻¹⁰ and 1.2 × 10⁻¹⁸, respectively) and transcripts (P = 0.00016 and 1.7 × 10⁻⁵), with mixed differences for metabolites (P = 0.012 and 0.23). Technical replicates shown (when possible) at 0 weeks. b, Shift frequencies for the top 10 species with greatest change during shifts, ranked by number of shifts as primary contributor, stratified by disease phenotype(s) (full table Supplementary Table 29). c, P. copri is of interest in arthritis23 and international populations44, and it alone retained stable abundances in CD but bloom-relaxation dynamics in controls (two-tailed Wilcoxon test of absolute differences between consecutive time points P = 4.2 × 10⁻⁶ between non-IBD and UC, and 1.1 × 10⁻⁴ between non-IBD and CD). Plot shows 22 subjects with at least one time point with more than 10% differential abundance (n = 267 samples). d, Ordination of temporally adjacent samples within individual, based on metabolomics (Bray–Curtis principal coordinates on normalized absolute abundance differences). Disease groups separate significantly (n = 440 sample pairs from 106 subjects; PERMANOVA R2 = 2.8%, P < 10−4). Urobilin, urate, and an unidentified untargeted feature that segregates with disease groups in the PCoA are shown (right); HILn_QI1594 (HILIC-neg method m/z = 152.0354, RT = 4.16 min). e, As in c, but for urate (two-tailed Wilcoxon test P = 0.0012 non-IBD–UC, P = 0.044 non-IBD–CD; n = 546 samples from 106 subjects).

