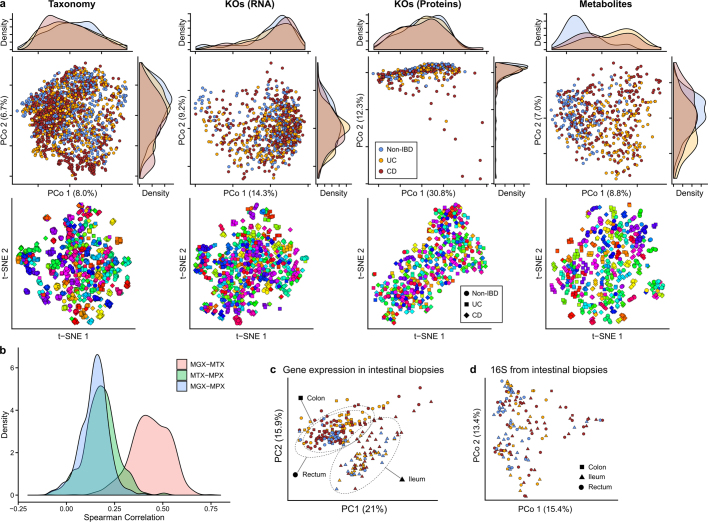
Extended Data Fig. 2. Within-individual stability is a major driver of microbiome differences across measurement types.
a, PCoA and t-SNE embeddings based on Bray–Curtis dissimilarity matrices from stool species abundances, transcripts, proteins, and metabolites. Marginal densities are shown for the PCoAs that show disease separation for some measurements. In the t-SNEs, each subject has been assigned a different hue, showing that small clusters generally represent individuals’ time courses, as inter-individual differences are the greatest driver of microbiome variation across measurement types (Fig. 1f). Sample counts are shown in Fig. 1b. b, Distributions of correlations between functional profiles, captured as UniRef90100 gene family abundances73, measured from paired metagenomes, metatranscriptomes, and metaproteomes (see Methods). c, Human transcriptional expression was mostly determined by biopsy location rather than IBD phenotype and inflammation (n = 249 samples from 91 subjects). Ordination shows PCA on gene expression levels normalized by library sizes and represented as CPM. Ellipses indicate 95% confidence regions for the indicated sample types. d, Principal coordinates plot (Bray–Curtis on OTU profiles) of community profiles from biopsy samples shows that mucosal microbial communities do not differ significantly by biopsy location (shape), unlike human gene expression in epithelial tissue (Fig. 4b).

