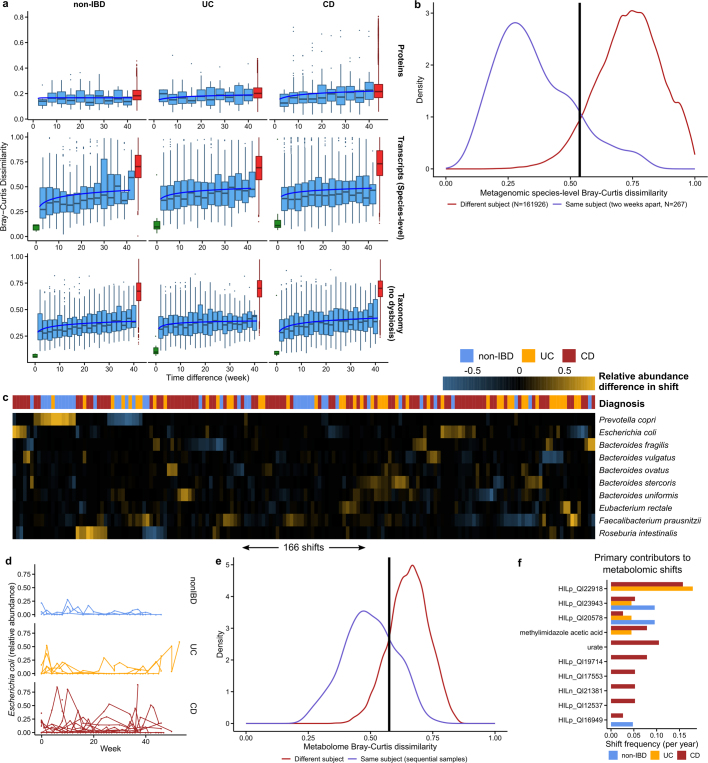
Extended Data Fig. 5. Detecting shifts in longitudinal microbiome multi-omics.
a, Distributions of Bray–Curtis dissimilarities as a function of time difference between samples for protein profiles, species-level transcriptional activity (see Methods), and species-level taxonomy (though excluding subjects with dysbiosis at any time point), otherwise as in Fig. 3a. Removing subjects with dysbiotic samples removes the extreme dissimilarities (near 1) observed in IBD subjects. Boxplots show median and lower/upper quartiles; whiskers show inner fences. b, Distribution of Bray–Curtis dissimilarities between samples from the same subject, two weeks apart versus those from different individuals, allowing us to define a ‘shift’ in the microbiome as a change more likely to have been drawn from the between-subject distribution than within-subject distances (corresponding to Bray–Curtis > 0.54). c, Relative abundance differences of the top ten microorganisms that contributed to each of the 183 detected taxonomic shifts among any two within-subject subsequent time points. Shifts are typically reciprocal (that is, losing a microorganism and regaining it later, or vice versa), and microorganism with frequent high-abundance shifts generally correspond to frequent contributors in Fig. 3b. Sample ordering is from a hierarchical clustering using average linkage followed by optimal leaf ordering101. d, As in Fig. 3c, but for E. coli (n = 322 samples from 24 subjects; two-tailed Wilcoxon test of the absolute differences in relative abundances between consecutive time points P = 2.2 × 10⁻⁴ for non-IBD to UC, and P = 0.029 for non-IBD to CD), which is frequently implicated in gut inflammation. e, As in b, but showing Bray–Curtis dissimilarities of metabolomic profiles. Here, 22% (96 out of 440) of sample pairs exceed the shift threshold, whereas 13% (183 out of 1,413) exceed the threshold in b. If metagenomic profiles are sub-sampled to match the metabolomics samples, this increases to 14% (57 out of 398) of sample pairs, showing that if we increased the sampling rate, this measurement type would be likely to shift more than the metagenomes. f, As in Fig. 3b, but showing the primary contributors to metabolomic shifts, that is, the metabolite with the largest change in relative abundance during a shift. Note that other metabolites may still experience large changes in abundance (for example, for this reason, urate was not a primary contributor to any non-IBD shifts, though large changes are visible for one non-IBD individual in Fig. 3e). The full table of detected metabolomic shifts is given in Supplementary Table 30. Violin plot shows the density of points around that intake frequency; bandwidth chosen automatically by Silverman’s method102.

