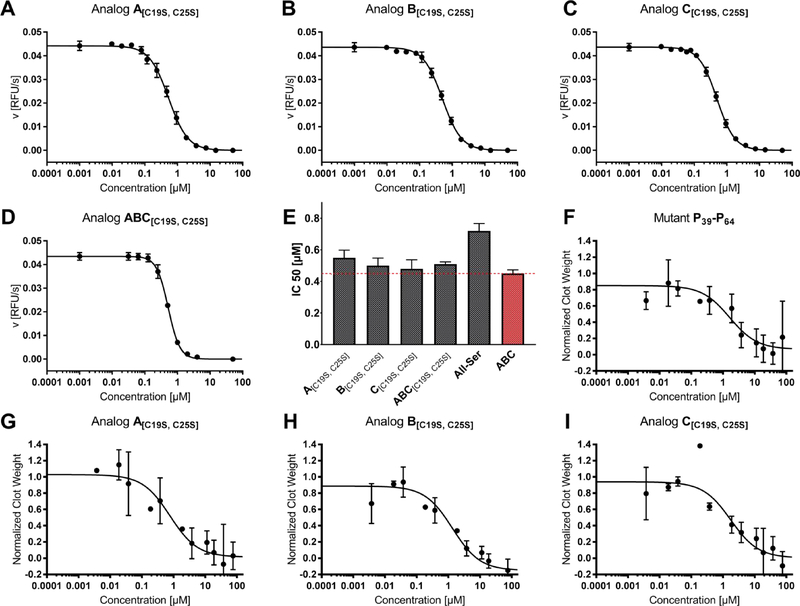
Figure 3.
Activity assays of different tridegin variants. A)–E) In vitro FXIII assay in a purified system: Exemplary IC50 plots of tridegin analogs A[C19S, C25S], B[C19S, C25S], C[C19S, C25S], ABC[C19S, C25S], and corresponding bar chart of averaged IC50 values in comparison to controls All-Ser and ABC. The dashed red line marks the IC50 value of wild type ABC. F)–I) Whole blood clot contraction assay of A[C19S, C25S], B[C19S, C25S], and C[C19S, C25S] in comparison to control P39-P64.

