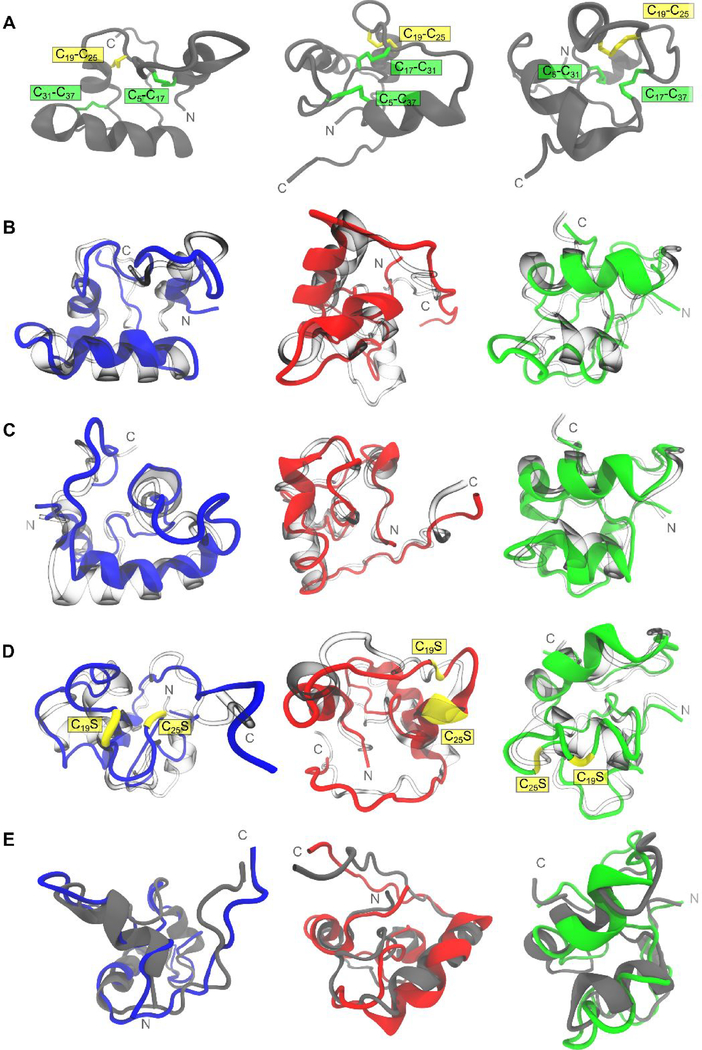
Figure 4.
Comparison of structural variability of tridegin isomers in simulation. A) The structures of the three isomers A, B, and C shown in a (grey) cartoon representation. The disulfide bonds are marked and highlighted. B) Simulated structures of A (blue), B (red), and C (green) superimposed on their respective starting structures (transparent/blown glass representation). C) Simulated structures of A (blue), B (red), and C (green) with in silico removal of the C19-C25 disulfide bond superimposed on their respective starting structures (transparent/blown glass representation). D) Simulated structures of A[C19S, C25S] (blue), B[C19S, C25S] (red), and C[C19S, C25S] (green) superimposed on their respective starting structures (transparent/blown glass representation). Serine mutations of cysteines (C19S and C25S) are depicted in yellow. E) Simulated structures of A[C19S, C25S] (blue), B[C19S, C25S] (red), and C[C19S, C25S] (green) superimposed on their respective parent 3-disulfide bonded isomers (grey cartoons from row A)). All simulated structures presented here refer to the energy-minimized structures of the final snapshot from the 300 ns MD simulation.

