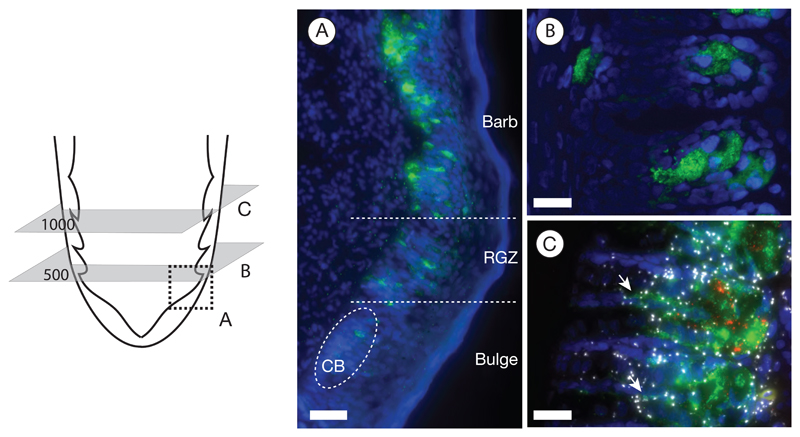
Figure 3. Melanocyte characterization.
The schematic of the proximal end of a feather follicle on the left side depicts the cutting planes for the images to the right. Melanocytes are visualized by immunostaining against the TYRP1 protein (in green); nuclei were stained with Hoechst 33342 (in blue).
A) The longitudinal section represented by the area of the dashed square illustrates the emergence of melanocytes in the collared bulge (CB) and their subsequent maturation in the ramogenic zone (RGZ) with increasing accumulation of the TYRP1 protein; bar = 50 μm.
B) Cross section showing barb ridges at an early developmental stage at 500 μm above the dermal papilla. The TYRP1 protein begins accumulating in a tubular cell body located in the ventral growth zone; bar = 20 μm.
C) Protein immunostaining combined with in situ mRNA padlock probe detection on a cross section at 1000 μm above the dermal papilla. At this developmental stage, melanocytes appear fully mature: the TYRP1 protein (in green) is predominantly accumulated in a spherical cell body sending dendritic cytoplasm into barbules plates (white arrow). Signals of rolling circle amplification (RCA) of in situ mRNA padlock probing tagging individual TYRP1 mRNA transcripts (shown in red) are confined to the cell body. In contrast to melanocyte specific gene expression of TYRP1, mRNA of the internal control gene ACTB (in white) is ubiquitously expressed across other cell types; bar = 20 μm.

