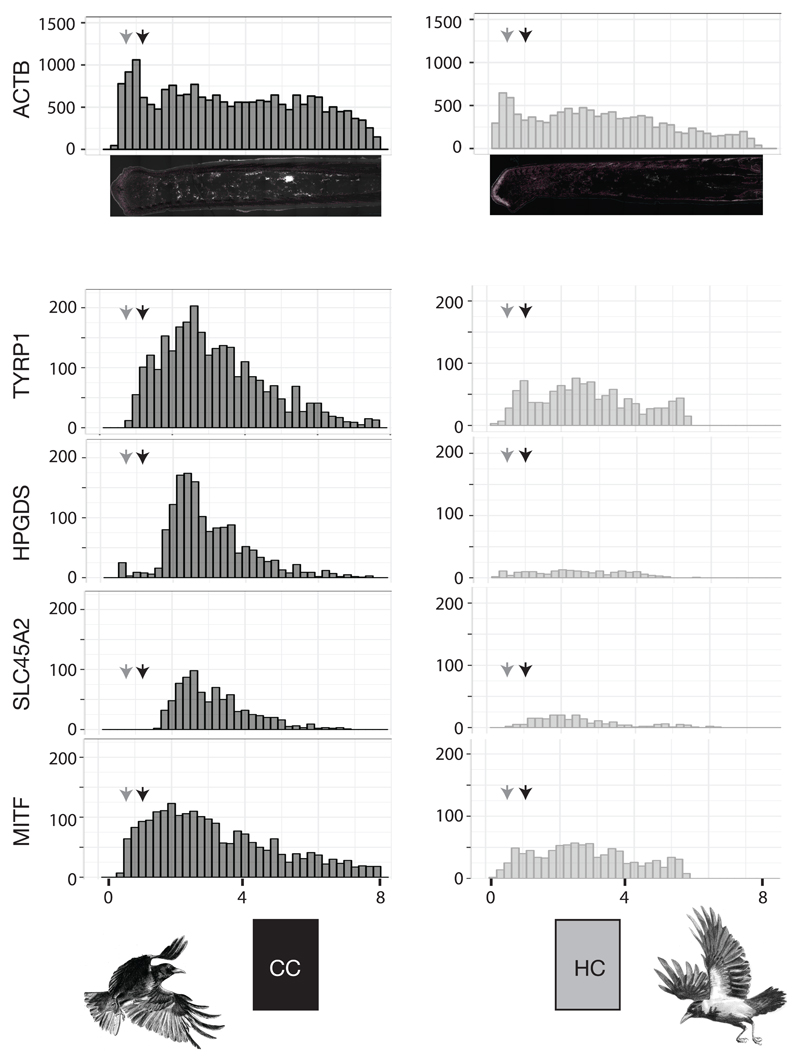
Figure 4. Longitudinal gene expression patterns of targeted mRNA transcripts in feathers from torso.
Histogram summarizing mRNA transcript abundance along the proximal-distal axis of feather follicles sampled from black torso of carrion crows (CC, left column) and grey torso of hooded crows (HC, right column). Each bin represents the raw counts of targeted RCA signals from mRNA transcripts of each candidate gene. Grey and black arrows indicate the position of cross sections at 500 μm and 1,000 μmabove the dermal papilla, respectively. (x-axis is the distance from the proximal end in mm. y-axis is accumulated raw RCS signal counts).

