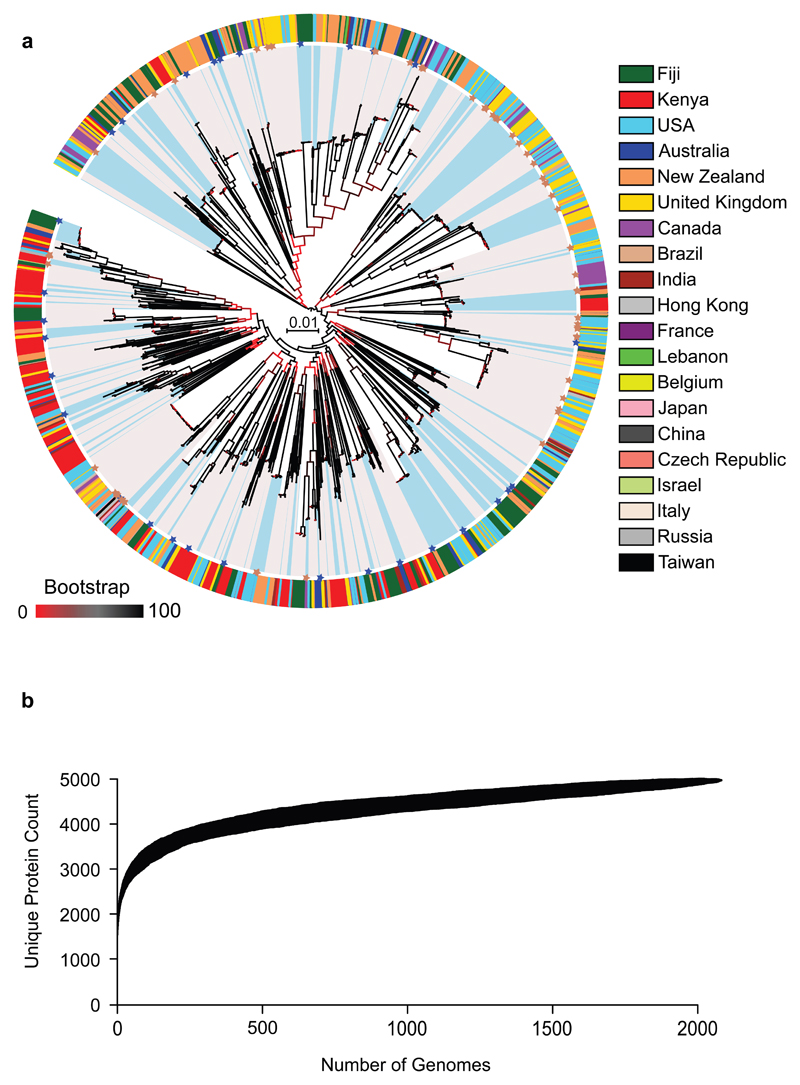
Figure 1. Population structure and pangenome of 2,083 globally distributed GAS strains.
(a) Maximum-likelihood phylogenetic tree of 30,738 SNPs generated from an alignment of 416 core genes. Branch colours indicate bootstrap support according to the legend. Distinct genetic lineages (n = 299) are highlighted in alternating colours (blue and grey) from the tips of the tree. Coloured asterisks refer to the relative position of complete GAS reference genome sequences (existing references are shown in brown; 30 new reference genomes are shown in dark blue). Colour coded around the outside of the phylogenetic tree is the country of isolation for each isolate. (b) Pangenome accumulation curve of 2,083 GAS genomes based on clustering of protein sequence at 70% homology.

