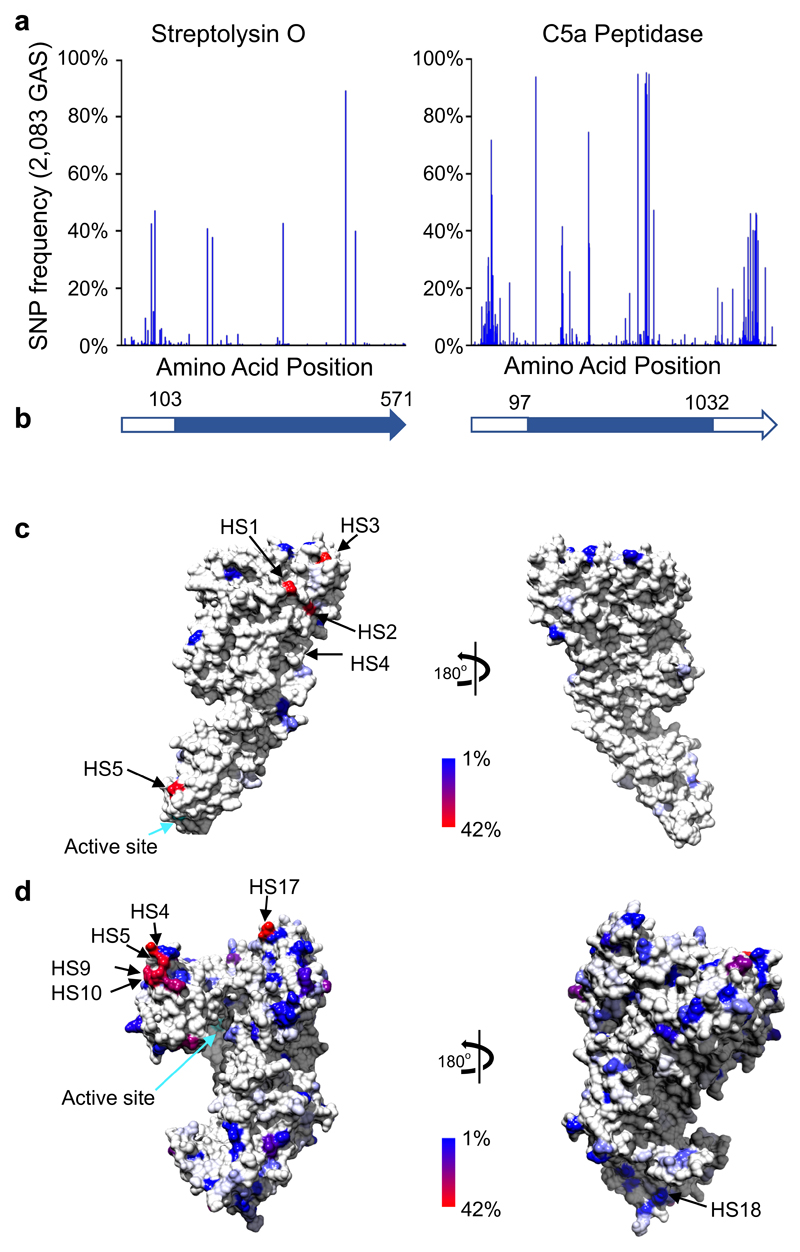
Figure 3. Global amino acid variation mapped onto the protein crystal structure of the mature GAS Streptolysin O34 and C5a peptidase35.
(a) Frequency of amino acid variations within 2,083 genomes. (b) Schematic of the Streptolysin O and C5a peptidase open reading frame representing the location of amino acids within the mature enzymes (blue block). Model of the consensus sequence of the Streptolysin O (c) and C5a peptidase (d) mature enzymes. Plotted against the structure is the amino acid variation frequency within the 2,083 GAS genomes as represented in the colour gradient from 1% variable (blue) to 42% variable (red); invariant sites are coloured in light grey. Position of the top 5 most variable surface hotspots (“HS”) are annotated (as defined in Supplementary Tables 10 and 11). Active sites for each enzyme are indicated (cyan arrow).

