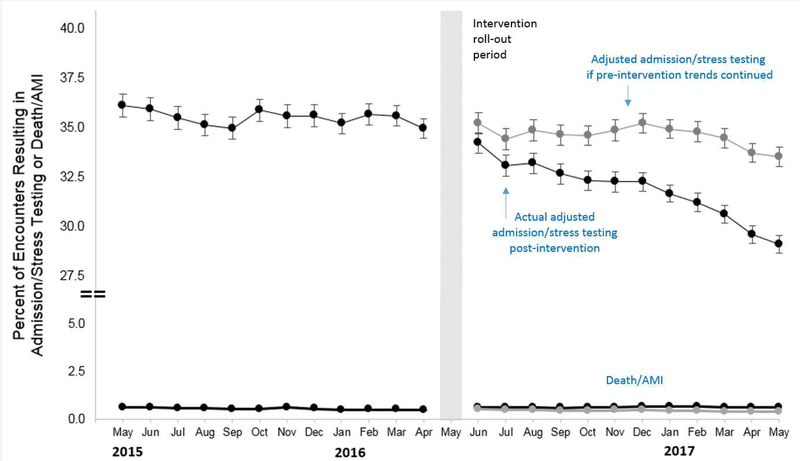
Figure 3:
Adjusted interrupted time series showing the changes in pre-and post-intervention month to month trends for ED chest pain encounters. The top black lines indicate encounters resulting in hospital admission and/or cardiac stress testing and the bottom black lines represent 30-day death and/or acute myocardial infarction (AMI) rates. The gray lines demonstrate the predicted results had the pre-intervention trends continued without the HEART care pathway.

