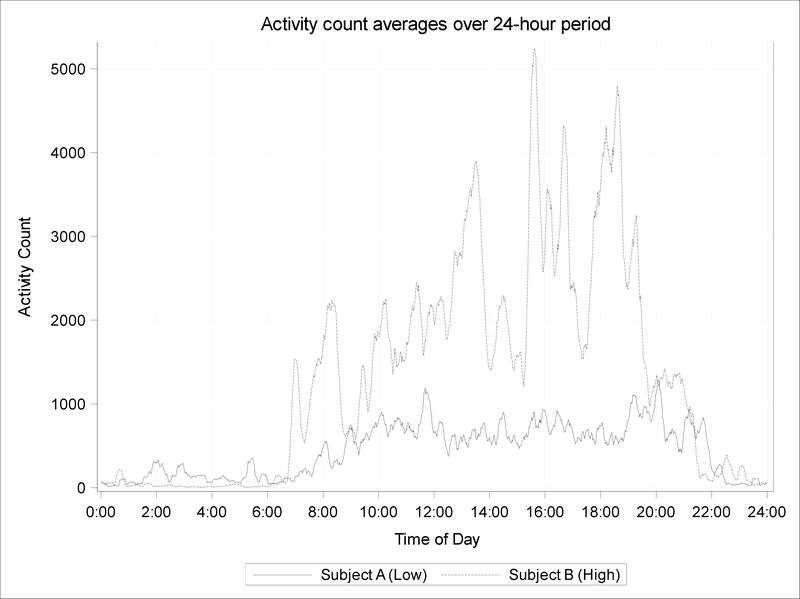
Figure 1.
Actigraphic measurements in two adolescents displaying different RA patterns. The solid line represents the raw activity scores of one adolescent with a low RA of 0.73 (Subject A) in comparison with an adolescent with a high RA of 0.99 (Subject B, dashed line). Data are smoothed by applying a moving average of 15 minutes. Note that the adolescent with a lower RA compared to higher RA has modestly higher activity overnight and markedly lower activity during the day.

