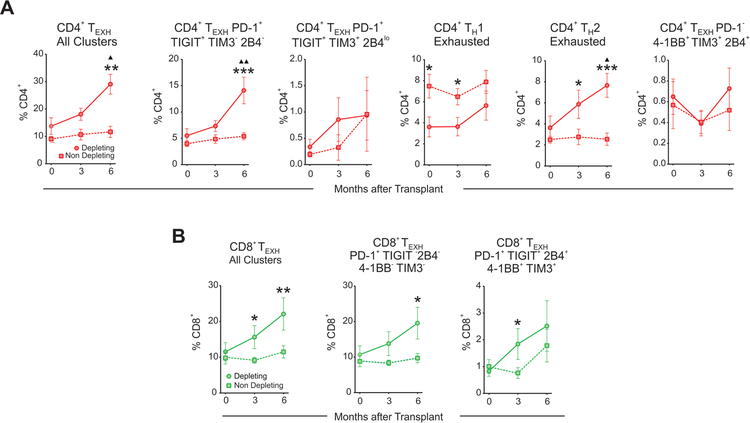
Figure 6. Lymphocyte depletion is associated with increased CD4+ TEXH and CD8+ TEXH.
Graphs depicting the evolution over time of the percentages post-transplant of all CD4+ TEXH (A) or CD8+ TEXH (B) subsets together and separately in subjects that received depleting (n=10 subjects) and non-depleting (n=16 subjects) induction therapy. Comparisons between depleting and non-depleting groups at the same time point by unpaired t-test (*p<0.05, **p<0.01, ***p<0.001) and with baseline for each group by paired t-test (▲p<0.05, ▲▲p<0.01). Data points are depicted as mean ± SEM.

