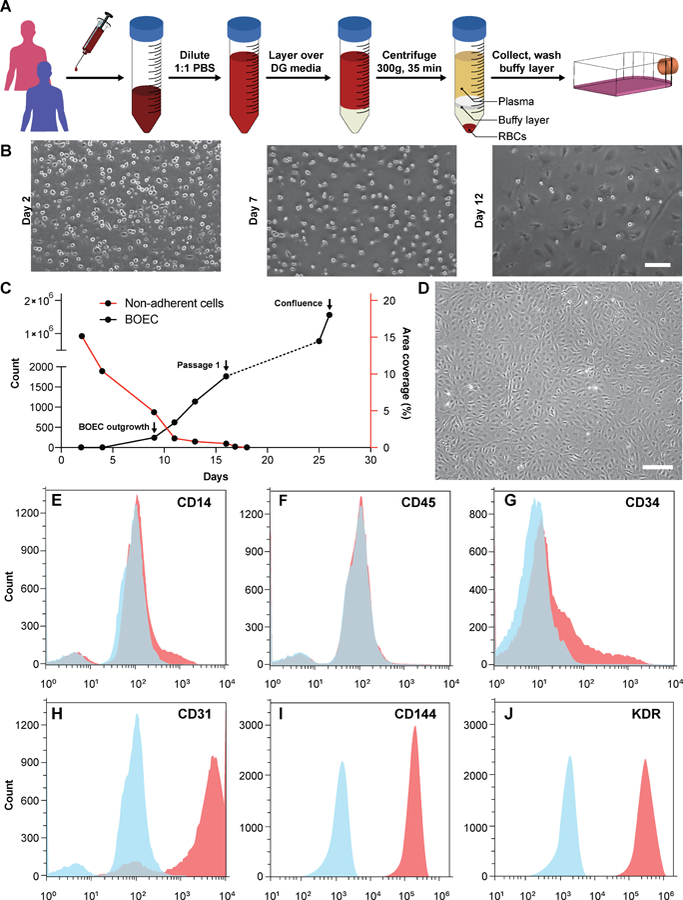
Figure 1. Blood outgrowth endothelial cell isolation and characterization.

(A) Schematic showing the BOEC isolation process. Whole blood is withdrawn in citrated tubes and diluted with PBS. The diluted blood is layered over density gradient (DG) media and centrifuged at 400g for 35 minutes after which the buffy layer is carefully collected, washed twice with PBS and finally added to culture flasks with growth media. (B) Timelapse images showing the gradual removal of non-adherent leukocytes and platelets from culture flasks seeded with cells isolated from buffy layer (scale bar: 50 µm). (C) Representative timelapse graph showing BOEC time of outgrowth colony appearance, subsequent subculture (passage 1) and confluence in a T25 cell culture flask (black line). Dotted line represents the growth of BOECs from passage 1 till they reach approximately 1 million cells. The red line represents the area coverage (%) of all the non-adherent cells (leukocytes, macrophages, platelets etc.) with time. (D) Brightfield image of cultured BOECs after isolation from whole blood. BOECs exhibit the classic endothelial “cobblestone” morphology (scale bar: 200 µm). Flow cytometry analysis of surface markers, (E) CD14, (F) CD45, (G) CD34, (H) CD31, (I) CD144 and (J) KDR present on BOECs. Red histograms represent staining with the antibody of interest; blue histograms are the relevant isotype controls.
