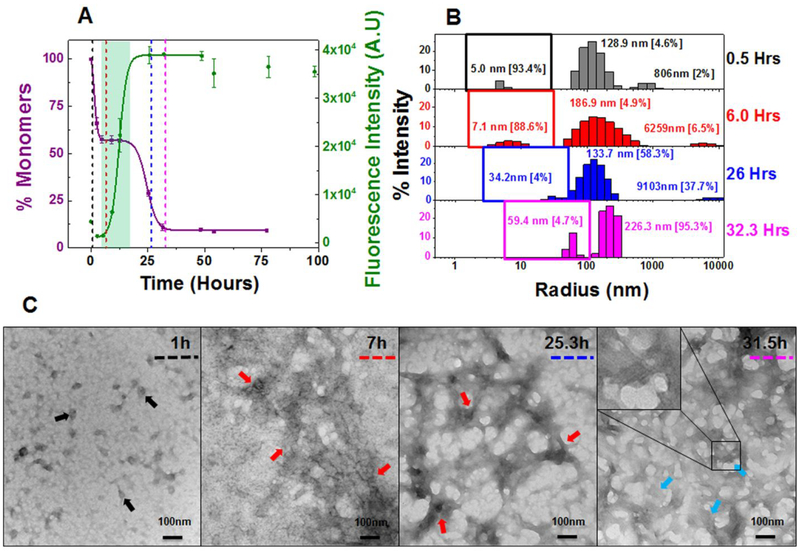
Figure 3: Composite analysis of monomer concentration, species size and abundance, and aggregate morphologies for 20 μM AL-09 during nucleation phase.
Shown are (A) the representative kinetic traces of the sedimentation assay (■) vs ThT Assay fluorescence intensity (●). The highlighted area in cyan green represents the plateau phase of the biphasic reaction (based on constant % monomeric concentration). The color coded dotted lines in (A) represents the time points when DLS was performed. (B) Peaks corresponding to hydrodynamic radii computed from scattering intensity obtained from DLS. The peaks inside the colored squares represent the radius corresponding to oligomeric intermediates. Values presented in the parenthesis adjacent to hydrodynamic radii represent the population density in percent mass of particles. (C) Electron Micrographs of 20 μM AL-09 at different time points during the course of aggregation. The color matched dotted line in the EM images compared to (A) and (B) represents closest time points when aliquots from the reaction mixture were studied during the course of aggregation. Arrow designation: (→) Spherical oligomers, (→) Aggregated nebular mesh of non-fibrillar oligomers, (→) Bundles of short fibrils. Scale bar, 100nm. Aggregation conditions: 10 mM ABC buffer at pH 2.0, 37°C, 300 rpm. Error bars in (A) represent Standard error of mean.

