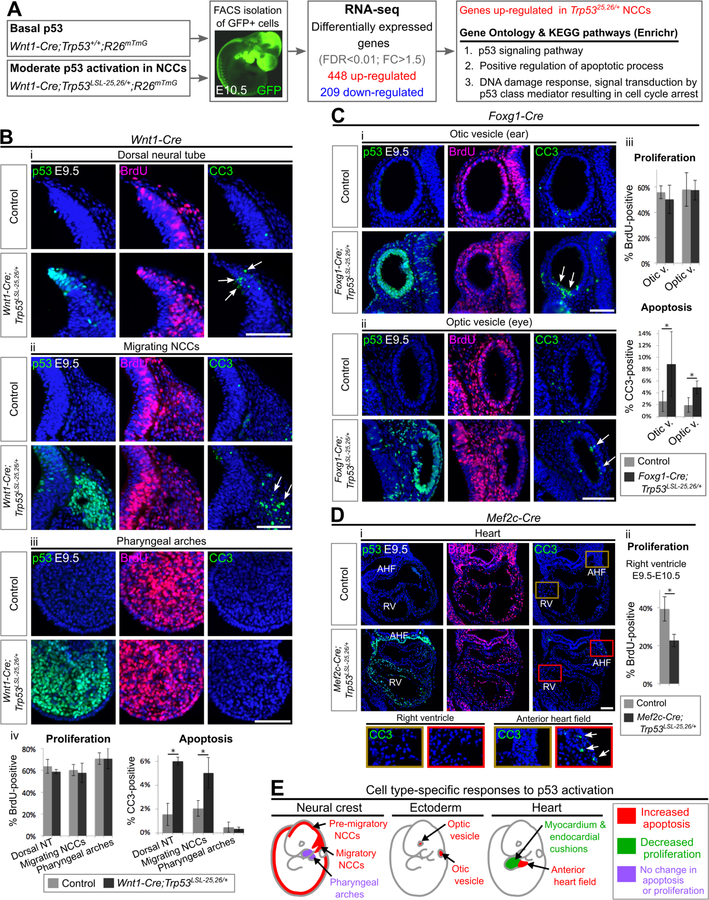
Figure 5. Moderate p53 activation triggers apoptosis in certain cell populations and restrains proliferation in others.
(A). RNA-seq experiment. n=5 embryos per genotype. FDR: false discovery rate, FC: fold change.
(B-D) Immunofluorescence staining for p53, BrdU and Cleaved Caspase 3 (CC3) on transverse sections of E9.5–10.5 embryos counterstained with DAPI (blue). Arrows indicate CC3-positive cells. Bar graphs represent mean ± SD. AHF: anterior heart field, RV: right ventricle. n=3–4 per genotype. *p<0.05. Scale bar: 100µm.
(E) Choice of cell fate following moderate p53 activation in different cell compartments.
See also Figure S3, Figure S4, Figure S5, Figure S6, Table S2, Table S3.

