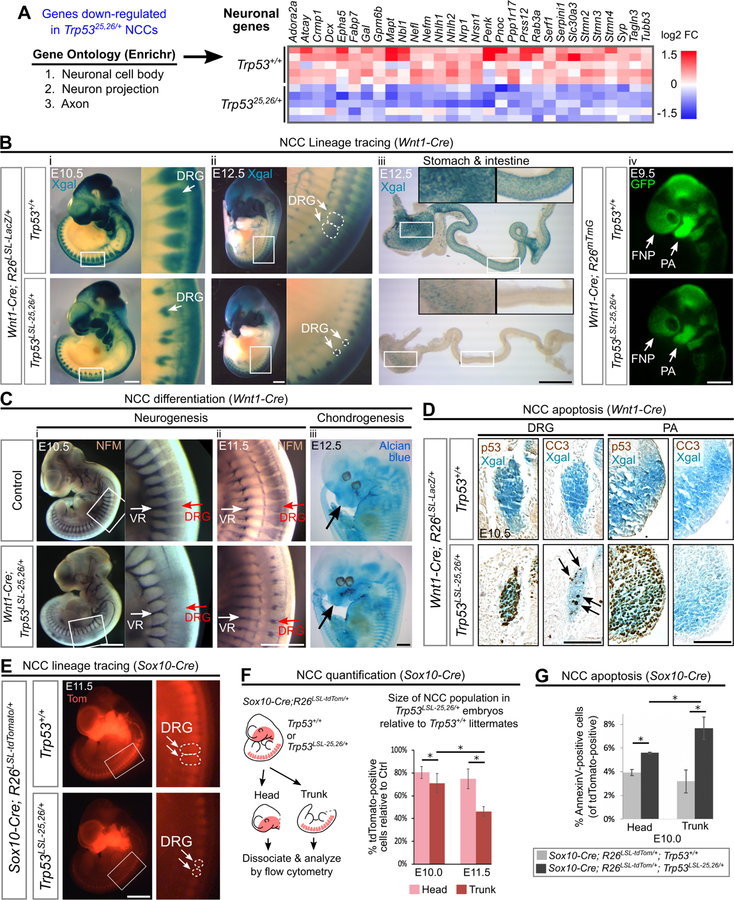
Figure 6. Neuronal populations are particularly sensitive to p53 activation.
(A) Left: Top 3 most significantly enriched Gene Ontology (GO) terms amongst the genes down-regulated in Trp5325,26/+ NCCs. Right: Heat map showing relative expression values for genes with GO classifications related to neuronal biology.
(B) (i-iii) NCC lineage tracing performed by Xgal staining of embryos carrying the R26LSL-LacZ reporter. In Wnt1-Cre;Trp53LSL−25,26/+;R26LSL-LacZ embryos, fewer Xgal-positive cells contribute to the DRG at E10.5–12.5 (100%, n=6) and to the stomach and intestine at E12.5 (100%, n=4) than in controls. (iv) NCC lineage tracing performed by visualizing GFP fluorescence in embryos carrying the R26mTmG reporter. In Wnt1-Cre;Trp53LSL−25,26/+;R26mTmG embryos, the contribution of GFP-positive cells to the PA and FNP is modestly decreased (100%, n=3).
(C) (i-ii) In Wnt1-Cre;Trp53LSL−25,26/+ embryos, whole mount neurofilament (NFM) staining is markedly decreased in the DRG at E10.5 (100%, n=4) and E11.5 (100%, n=3) but is not dramatically affected in the ventral roots (VR), which are not derived from NCCs. (iii) In Wnt1-Cre;Trp53LSL−25,26/+ embryos, Alcian blue staining (cartilage) in the NCC-derived cranial regions (arrow) appears relatively normal (n=3).
(D) Immunohistochemical staining (brown) for p53 and CC3 on transverse sections from whole mount Xgal-stained (blue) embryos. In Wnt1-Cre;Trp53LSL−25,26/+;R26LSL-LacZ embryos, CC3-positive cells (arrows) are observed within the DRG but not the first PA. n=3.
(E) NCC lineage tracing performed by visualizing tdTomato (Tom) fluorescence in embryos carrying the R26LSL-tdTomato reporter. In Sox10-Cre;Trp53LSL−25,26/+;R26LSL-tdTomato embryos, the contribution of tdTomato-positive cells to the DRG is markedly decreased (100%, n=3).
(F) Flow cytometry-based quantification (mean±SD) of the percentage of tdTomato-positive cells in the head and trunk of Sox10-Cre;Trp53LSL−25,26/+;R26LSL-tdTomato embryos relative to Sox10-Cre;Trp53+/+;R26LSL-tdTomato littermate controls. n=3 per genotype. *p<0.05.
(G) Flow cytometry-based quantification (mean±SD) of the percentage of head or trunk tdTomato-positive cells that are AnnexinV-positive. n=3 per genotype. *p<0.05.
DRG: dorsal root ganglia. PA: pharyngeal arch. FNP: frontonasal prominence. Scale bar: 1mm (Bi-iii;C;E), 400µm (Aiv). 100µm (D). See also Figure S1, Figure S6, Table S2, Table S3.

