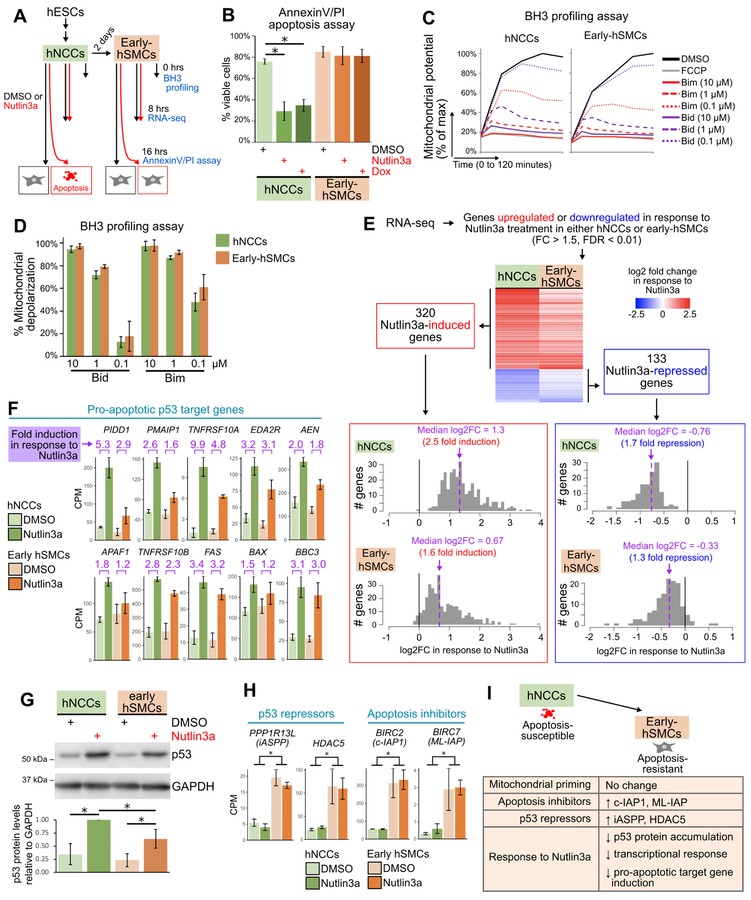
Figure 7. Early-hSMCs are resistant to p53-driven apoptosis, are highly primed, and exhibit a dampening of the transcriptional response to p53 activation.
(A) Outline of experiments.
(B) Flow cytometry-based quantification (mean±SD) of viable cells (AnnexinV- and propidium iodide (PI)-negative) in hNCCs and early-hSMCs treated with DMSO, Nutlin3a or Doxorubicin (Dox) for 16 hours. n=3 per treatment. *p<0.05.
(C) Change in mitochondrial potential (JC-1 fluorescence) over time in hNCCs and early-hSMCs treated with DMSO, FCCP, or Bim and Bid peptides.
(D) Percent mitochondrial depolarization (mean±SD), calculated from the JC-1 kinetic traces as the area under the curve relative to DMSO (100%) and FCCP (0%). n=3.
(E) Heat map (upper) and histograms (lower) of all genes that were Nutlin3a-responsive in either hNCCs or early-hSMCs. The heatmaps and histograms depict the fold change (log2) when comparing Nutlin3a-treated samples (n=3) to DMSO-treated samples (n=3).
(F) Counts per million (CPM) for p53 target genes encoding components of the extrinsic or intrinsic apoptotic pathways (mean±SD).
(G) Upper: representative immunoblot of lysates from hNCCs and early-hSMCs 8hrs after treatment with DMSO or Nutlin3a. Lower: quantification of p53 protein levels relative to GAPDH levels in 3 independent immunoblots (mean±SD). In each experiment, data were normalized such that the p53 levels in the Nutlin3a-treated hNCC sample was equal to 1. *p<0.05.
(H) Counts per million (CPM) for genes encoding p53 repressors and apoptosis inhibitors (mean±SD). *p<0.05.
(I) Model depicting similarities and differences between early-hSMCs and hNCCs.

