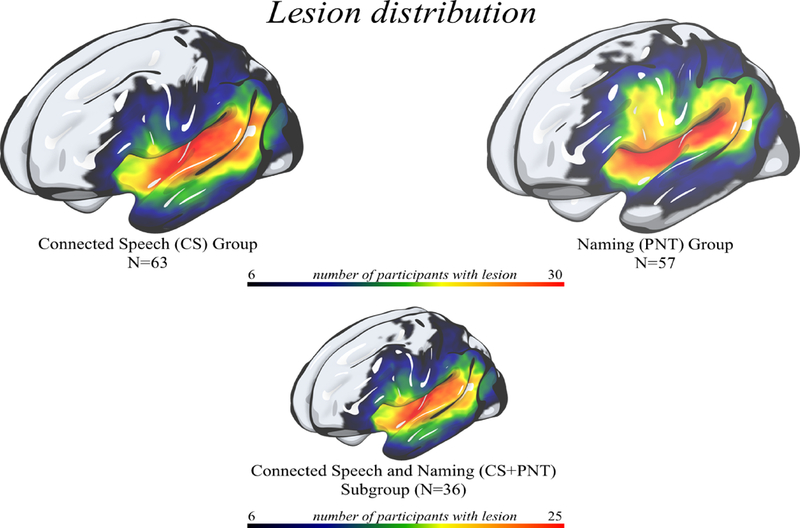
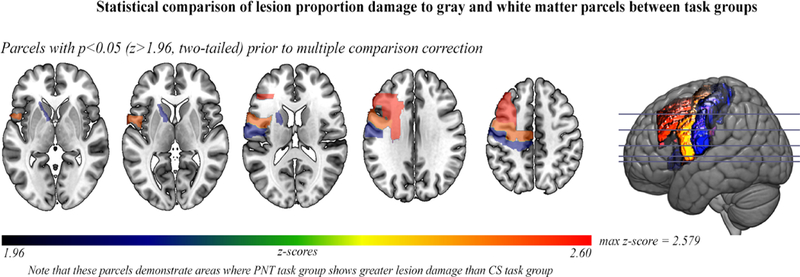
Figure 1: Distribution of lesions for each task group (CS task group, PNT task group, CS+PNT subgroup).


1A: A heat map on rendered surface showing lesion distributions for the participants included in the CS task group (top, left); PNT task group (top, right) and CS+PNT subgroup (bottom). Areas in red demonstrate where more participants share a lesion to that voxel.
1B: Prior to multiple comparison correction, a comparison of left hemisphere lesion proportion damage to parcels between task groups shown on axial slices with a left hemisphere sagittal cross-slice. Parcellation was from the Johns Hopkins University atlas (Faria et al., 2012), which contained gray-and white-matter parcels (182 in the whole brain). When comparing lesion damage to each parcel between the CS and PNT task groups, there was not a significant difference between lesion proportion damage to a parcel after multiple comparison correction (FDR; q=0.05). Prior to multiple comparison correction, six dorsal stream parcels were significantly more damaged in the PNT task group than the CS task group at p<0.05 (z>1.96); these are shown in the figure. P-values for these parcels ranged from p=0.0098 (middle frontal gyrus) to p=0.036 (underlying white matter, internal capsule.
