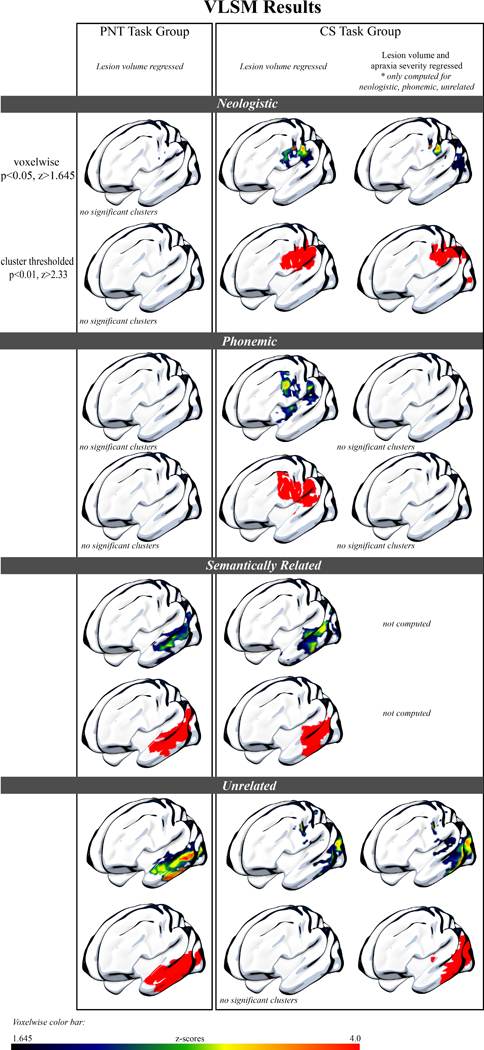
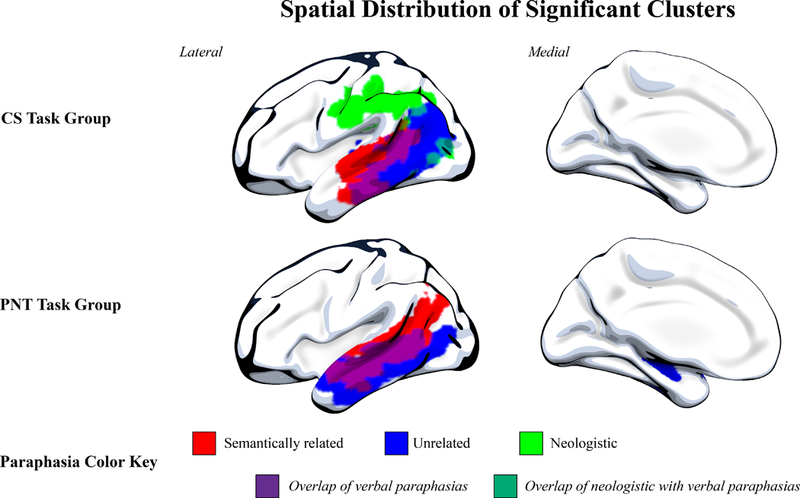
Figure 4: Results of the voxelwise lesion symptom mapping on the CS and PNT task groups.


4A: Surface rendering of the significant results of the VLSM analysis for the PNT task group (left) and CS task group (right). Both the PNT and CS task group results, which demonstrate damage significantly associated with each paraphasia type, have variance from lesion volume removed. In the far-right column, we also present results from the CS task group with variance from both lesion volume and apraxia of speech severity removed, as apraxia of speech severity was significantly correlated with neologistic, phonemic and unrelated paraphasias in this group. Lesion damage significantly associated with sound paraphasias (neologistic, phonemic) was only found for the CS task group, and demonstrated a dorsal distribution. Lesion damage significantly associated with verbal paraphasias (semantically related, unrelated) was found for both task groups, and demonstrated a more ventral distribution.
4B: Spatial distribution of significant clusters. Here, we demonstrate the spatial distribution of each significant cluster by paraphasia type and task group. As in Figure 4A, variance from lesion volume has been regressed from all analyses, and for the CS task group, we present neologistic and unrelated areas with apraxia of speech variance also regressed. Phonemic paraphasias are not demonstrated here, as there was not a significant cluster for phonemic paraphasia in the PNT task group after lesion volume regression or for the CS task group after both lesion volume and apraxia of speech severity regression. This figure demonstrates the distinction in dorsal and ventral streams associated with sound and verbal paraphasias, respectively.
